Column and row resizing
You can change the default size of the cells with a few clicks.
To resize the rows and columns
- Drag the header border of the row/column to resize its height/width.
- Drag the header border of the row to resize its height.
Example
Resize the columns widths:
To return the cells to the initial size, click twice on the header of the row or column:
Use the conditional formatting feature to highlight important values and make your report look more personalized.
To apply conditional formatting
To implement your own logic of highlighting the data, follow the steps below:
- On the Toolbar, choose the Format tab () > Conditional formatting.
- Select the plus-sign icon.
- Choose a value that you want to format (e.g., Sum of Price). If necessary, you can format all values at once.
- Add a rule; for example, “Less than 100” will apply the changes to all the cells with a value less than 100.
- Select colors for the text and background, and change the font if necessary.
- Press the Apply button to see the changes on the grid.
You can add multiple conditions of formatting to the same measure. Each condition is described by the Conditional Format Object and is saved in the report.conditions property.
Our pivot table can easily be translated into different languages. This article describes the process of language localization for WebDataRocks reporting component.
Available localizations
- English (default)
- French
- German
- Spanish
- Italian (partial)
- Dutch
- Brazilian Portuguese
- Chinese
- Turkish
- Polish
- Urdu
Localization files for new languages can be added by creating a new pull request on GitHub. Our team highly appreciates any help.
Create a custom localization file
Follow the steps below to create your own localization file based on our template:
Step 1. Download template JSON file. It contains all labels that are used in WebDataRocks and English values for them.
Step 2. Translate values into the language you want.
For example, you want a Spanish localization. You start from replacing the first label-value pair from the template ("flatHierarchyBox": "Select and arrange columns") with its Spanish equivalent ("flatHierarchyBox": "Seleccionar y organizar columnas") and keep on the same way with the whole file (e.g., check Spanish translated sample).
Localize a specific report
To set a specific language for a report, add a report.localization property with the necessary localization:
Set the localization as a URL to the file
const report = {
  dataSource: {
    filename: "https://cdn.webdatarocks.com/data/data.csv"
  },
  // Replace this file with your own localization file
  localization: "https://cdn.webdatarocks.com/loc/es.json"
};
Set the localization as an inline JSON object
const report = {
  dataSource: {
    filename: "https://cdn.webdatarocks.com/data/data.csv"
  },
  // Replace the translation below with your own labels
  localization: {
    toolbar: {
      connect: "Conectar",
      open: "Abierto",
      save: "Salvar",
      export: "Exportar",
      // Other labels
    }
  }
};
Set localization for all reports
If you want to set one language for all reports, add a global object with localization when initializing WebDataRocks:
Set the localization as a URL to the file
<script setup>
  import { Pivot } from "@webdatarocks/vue-webdatarocks";
  import "@webdatarocks/webdatarocks/webdatarocks.css";

  const report = {
    // Your report
  };

  const globalReport = {
    // Replace this file with your own localization file
    localization: "https://cdn.webdatarocks.com/loc/es.json"
  };
</script>

<template>
  <div>
    <Pivot
      v-bind:report="report"
      v-bind:global="globalReport"
      toolbar
    />
  </div>
</template>
Set the localization as an inline JSON object
<script setup>
  import {Pivot} from "@webdatarocks/vue-webdatarocks";
  import "@webdatarocks/webdatarocks/webdatarocks.css";

  const report = {
    // Your report
  };

  const globalReport = {
    // Replace the translation below with your own labels
    localization: {
      toolbar: {
        connect: "Conectar",
        open: "Abierto",
        save: "Salvar",
        export: "Exportar",
        // Other labels
      }
    }
  };
</script>

<template>
  <div>
    <Pivot
      v-bind:report="report"
      v-bind:global="globalReport"
      toolbar
    />
  </div>
</template>
Learn more about the Global Object.
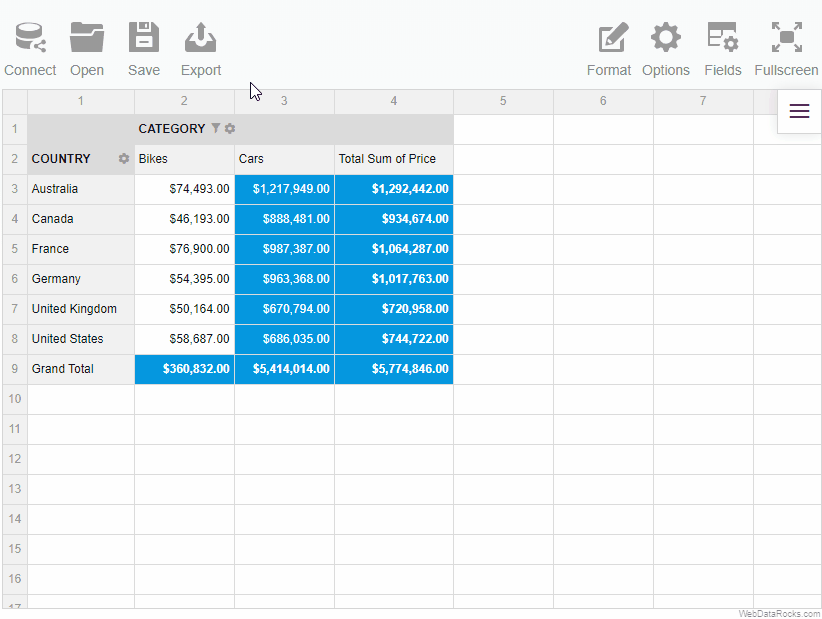
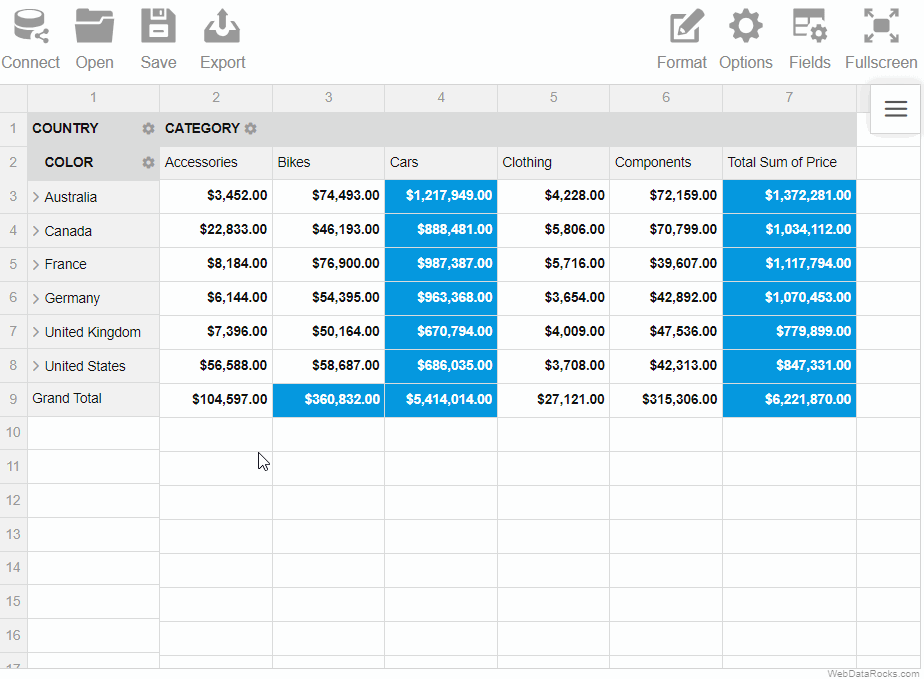
A grand total is a value that is composed by adding together other total amounts (subtotals) of the row/column.
When creating a report, you can change the default way grand totals and subtotals are displayed on the grid. The available options are:
- Show and hide grand totals for the entire report
- Show and hide subtotals for the entire report
- Show grand totals only for the rows or columns
- Show subtotals only for the rows or columns
To show or hide grand totals and subtotals
Via UI
- Go to the Options () tab on the Toolbar.
- Choose how to display grand totals and subtotals.
- Apply the changes.
Programmatically
Configure totals through the grid.showTotals property of the Options Object:
const report = {
  options: {
    grid: {
      showTotals: "off"
    }
  }
};
Configure grand totals through the grid.showGrandTotals property of the Options Object:
const report = {
  options: {
    grid: {
      showGrandTotals: "rows"
    }
  }
};
It is also possible to set grid.showTotals and grid.showGrandTotals options for all reports.
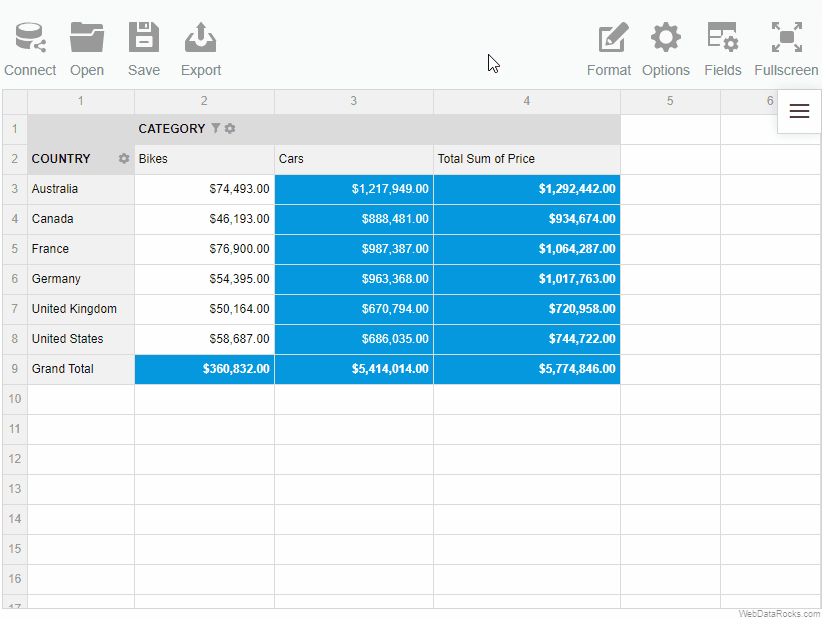
Example
Hide grand totals from the entire report:
Hide grand totals from the rows:

The layout of subtotals is changed similarly.
In WebDataRocks Pivot Table, data can be displayed in aggregated views or as a simple table. You can switch between three standard layouts to display the report data differently:
- Compact pivot table – neat and concise data presentation.
- Classic pivot table – an Excel-like layout.
- Flat table – a simple grid with non-aggregated data.
Compact form
The compact pivot table form is enabled by default. This layout helps keep your data in a neat and concise style.
Features:
- Compact form enhances the readability of the report.
- If the rows contain more than one field, the members of the inner field can be expanded and collapsed by clicking on the outer field’s member name.
- If the members of the field in the rows are expanded, they are placed one under the other, without being transferred to a separate column.
- If the members of the field in the columns are expanded, they are placed in a separate row.
- Subtotals are shown at the end of each row in a separate column.
- Grand totals are placed at the bottom in a separate row.
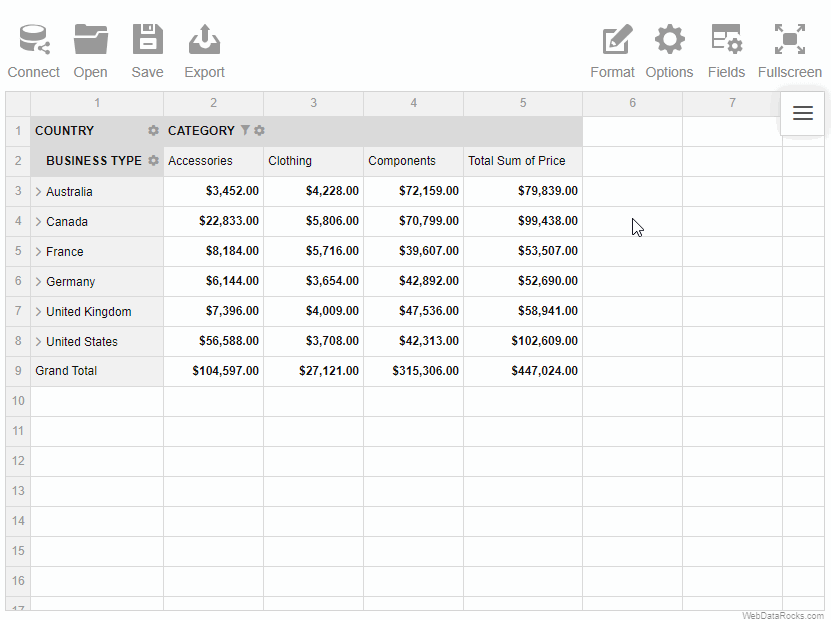
Classic form
The classic pivot table form suits perfectly those who would like to have an Excel-like user experience.
Features:
- If the rows contain more than one field, the members of the inner field can be expanded and collapsed by clicking on the outer field’s member name.
- If the members of the field in the rows are expanded, they are placed in a separate column. It is the main feature that distinguishes the classic layout from the compact one.
- If the members of the field in the columns are expanded, they are placed in a separate row.
- Subtotals are shown in a separate row after each hierarchy in the rows.
- Grand totals are placed at the bottom in a separate row.
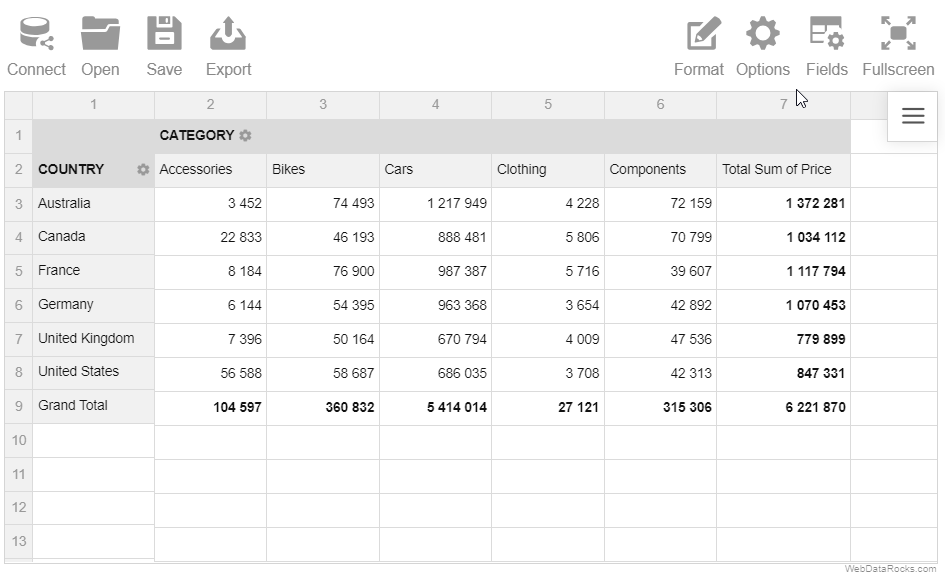
Flat form
The flat table is a raw data view, which reflects the data’s original structure. It’s the simplest form among the others.
Features:
- The data is shown without aggregation.
- Each field is placed in a separate column.
- Grand totals are placed in the first row.
To change the grid form
Via UI
- Go to the Options tab () on the Toolbar.
- Select the form of your choice.
- Apply the changes.
Programmatically
Set a grid layout through the grid.type property of the Options Object:
const report = {
  options: {
    grid: {
      type: "classic"
    }
  }
};
It is also possible to set the grid.type option for all reports.
You can save your current report and load it later with all your settings: slice, formats, filters, sorting, conditions, and options.
To save the report via UI
- Click the Save button () on the Toolbar.
The report will be saved to your local file system in JSON format. Later you can open this report in WebDataRocks and see your previous configurations on the grid.
Here’s a demo showing how to save a report via the Toolbar:
To save the report programmatically
Use the save() method:
pivotRef.value.webdatarocks.save();
The saved report will contain only the configurations you’ve explicitly defined. To save the report with default or global configurations, see the next section.
Saving the report with default and global configurations
The save() method has parameters that allow you to save the report:
- With global configs
- With default configs
- With global and default configs
Now let’s have a look at each of these approaches in detail. For simplicity, we’ll focus on how options are saved, but data source and slice configs are saved similarly.
With default configs
How to save. Run the save() method with the withDefaults option:
pivotRef.value.webdatarocks.save({
  withDefaults: true
});
How it works. Let’s define the following report:
<script setup>
  import { Pivot } from "@webdatarocks/vue-webdatarocks";
  import "@webdatarocks/webdatarocks/webdatarocks.css";

  const reportJson = {
    dataSource: {
      filename: "https://cdn.flexmonster.com/data/data.json"
    },
    options: {
      grid: {
        type: "flat",
        showHeaders: false
      },
      configuratorActive: true
    }
  };
</script>

<template>
  <div>
    <Pivot
      ref="pivotRef"
      v-bind:report="reportJson"
      toolbar
    />
  </div>
</template>
As you can see, we’ve defined only a few options in the report. Now if we save this report with default configs, we’ll see more options in the saved file:
{
 "dataSource": {
   // Data source configs
 },
 "slice": {
   // Slice configs
 },
 "options": {
   "grid": {
     "type": "flat",
     "title": "",
     "showFilter": true,
     "showHeaders": false,
     "showTotals": "on",
     "showGrandTotals": "on",
     // Other grid options
   },
   "configuratorActive": true,
   "configuratorButton": true,
   "showAggregations": true,
   "showCalculatedValuesButton": true,
   "drillThrough": true,
   "showDrillThroughConfigurator": true,
   // Other general options
 }
}
Notice that the options.grid.type, options.grid.showHeaders, and options.configuratorActive properties have values that we’ve set manually, whereas their default values are different — check them in the Options Object.
You can also check default values for the Slice Object and Data Source Object.
With global configs
How to save. Run the save() method with the withGlobals option:
pivotRef.value.webdatarocks.save({
  withGlobals: true
});
How it works. Let’s configure the component as follows:
<script setup>
  import {Pivot} from "@webdatarocks/vue-webdatarocks";
  import "@webdatarocks/webdatarocks/webdatarocks.css";

  const reportJson = {
    dataSource: {
      filename: "https://cdn.flexmonster.com/data/data.json"
    },
    options: {
      grid: {
        type: "classic"
      },
      configuratorActive: false
    }
  };

  const globalReportJson = {
    options: {
      grid: {
        type: "flat",
        showHeaders: false
      },
      configuratorActive: true
    }
  };
</script>

<template>
  <div>
    <Pivot
      ref="pivotRef"
      v-bind:report="reportJson"
      v-bind:global="globalReportJson"
      toolbar
    />
  </div>
</template>
We have defined global options, and some of them are overwritten in the report.
Now if we save this report with global configs, we’ll see the following options section in the saved file:
{
  "dataSource": {
    // Data source configs
  },
  "slice": {
    // Slice configs
  },
  "options": {
    "grid": {
      "type": "classic",
      "showHeaders": false
    }
  }
}
If we compare the initial configurations and the saved report, we’ll learn the following:
- If a configuration is defined globally and not defined in the report, the global value will be saved to the report (see the
grid.showHeadersoption in the example). - If a configuration is defined both globally and in the report, the global value is ignored (see the
grid.typeoption in the example). - If a global configuration is overwritten in the report, but its new value matches its default value, the configuration is not included in the saved report (see the
configuratorActiveoption in the example).
With default and global configs
How to save. Run the save() method with the withDefaults and withGlobals options:
pivotRef.value.webdatarocks.save({
  withDefaults: true,
  withGlobals: true
});
How it works. This approach is a combination of the previous approaches. For example, let’s save the following report with defaults and globals:
<script setup>
  import {Pivot} from "@webdatarocks/vue-webdatarocks";
  import "@webdatarocks/webdatarocks/webdatarocks.css";

  const reportJson = {
    dataSource: {
      filename: "https://cdn.flexmonster.com/data/data.json"
    },
    options: {
      grid: {
        type: "classic"
      },
      configuratorActive: false
    }
  };

  const globalReportJson = {
    options: {
      grid: {
        type: "flat",
        showHeaders: false
      },
      configuratorActive: true
    }
  };
</script>

<template>
  <div>
    <Pivot
      ref="pivotRef"
      v-bind:report="reportJson"
      v-bind:global="globalReportJson"
      toolbar
    />
  </div>
</template>
The saved file will look similar to the following:
{
  "dataSource": {
    // Data source configs
  },
  "slice": {
    // Slice configs
  },
  "options": {
    "grid": {
      "type": "classic",
      "title": "",
      "showFilter": true,
      "showHeaders": false,
      "showTotals": "on",
      "showGrandTotals": "on",
      // Other grid options
    },
    "configuratorActive": false,
    "configuratorButton": true,
    "showAggregations": true,
    "showCalculatedValuesButton": true,
    "drillThrough": true,
    "showDrillThroughConfigurator": true,
    // Other general options
  }
}
As you can see from the saved report:
- The
grid.showHeadersoption is not overwritten in the report, so it has its global value (false). - The
grid.typeoption is overwritten in the report, so its global value is ignored (grid.typeis"classic", not"flat"). - All other options have their default values, thanks to the
withDefaults: true.
See also
After formatting your JSON data and setting data types for fields, you can start connecting to the data.
Connect to JSON via UI
Step 1. Go to the Connect tab () on the Toolbar.
Step 2. Choose the JSON you want to connect to:
- Local JSON. Use this option to load a file from your local file system.
- Remote JSON. Use this option to load a remote JSON file by its URL or data returned by a server-side script.
Connect to JSON programmatically
There are two ways to connect to JSON programmatically:
1) To connect to inline JSON data in the report, use the dataSource.data property:
<script setup>
  import {Pivot} from "@webdatarocks/vue-webdatarocks";
  import "@webdatarocks/webdatarocks/webdatarocks.css";

  const reportJson = {
    dataSource: {
      data: [
        {
          "Product": "Apple",
          "Price": 2.50
        },
        {
          "Product": "Cherry",
          "Price": 5.25
        }
      ]
    }
  };
</script>

<template>
  <div>
    <Pivot
      v-bind:report="reportJson"
      toolbar
    />
  </div>
</template>
2) If your JSON data is in a file or is returned by a server-side script, specify the URL in the dataSource.filename property:
<script setup>
  import {Pivot} from "@webdatarocks/vue-webdatarocks";
  import "@webdatarocks/webdatarocks/webdatarocks.css";

  const reportJson = {
    dataSource: {
      filename: "URL-to-your-JSON-file"
    }
  };
</script>

<template>
  <div>
    <Pivot
      v-bind:report="reportJson"
      toolbar
    />
  </div>
</template>
Set a JSON data source for all reports
To set a JSON data source for all reports, specify it in the Global Object:
import { Component } from "@angular/core";
import { WebdatarocksPivotModule } from "@webdatarocks/ngx-webdatarocks"

@Component({
  selector: "app-root",
  standalone: true,
  imports: [WebdatarocksPivotModule],
  templateUrl: "./app.component.html",
  styleUrls: ["./app.component.css"]
})
export class AppComponent {
  globalReportJson = {
    dataSource: {
      type: "json",
      filename: "URL-to-your-JSON-file"
    }
  };

  reportJson = {
    // Your report
  };
}
<app-wbr-pivot
 [toolbar]="true"
 [global]="globalReportJson"
 [report]="reportJson">
</app-wbr-pivot>
<script setup>
  import {Pivot} from "@webdatarocks/vue-webdatarocks";
  import "@webdatarocks/webdatarocks/webdatarocks.css";

  const globalReportJson = {
    dataSource: {
      type: "json",
      filename: "URL-to-your-JSON-file"
    }
  };
  const reportJson = {
    // Your report
  };
</script>

<template>
  <div>
    <Pivot
      v-bind:global="globalReportJson"
      v-bind:report="reportJson"
      toolbar
    />
  </div>
</template>
See also
- Supported JSON formats
- Setting data types
- Creating multilevel hierarchies in JSON
- Metadata object for JSON
After formatting your CSV data and setting data types for fields, you can start connecting to the data.
Connect to CSV via UI
Step 1. Go to the Connect tab () on the Toolbar.
Step 2. Choose the CSV you want to connect to:
- Local CSV. Use this option to load a file from your local file system.
- Remote CSV. Use this option to load a remote file by its URL or data returned by a server-side script.
Here’s an example of connecting to a remote CSV file:
Connect to CSV programmatically
To load your remote CSV data (a remote CSV file or data returned by a server-side script), specify the URL in the dataSource.filename property:
<script setup>
  import {Pivot} from "@webdatarocks/vue-webdatarocks";
  import "@webdatarocks/webdatarocks/webdatarocks.css";

  const reportCsv = {
    dataSource: {
      filename: "URL-to-your-CSV-file"
    }
  };
</script>

<template>
  <div>
    <Pivot
      v-bind:report="reportCsv"
      toolbar
    />
  </div>
</template>
Specify a custom field separator
By default, WebDataRocks supports a comma , or a semicolon ; as a field separator. If fields in your data are separated by another character, e.g., a colon :, you need to specify this character in the dataSource.fieldSeparator property. For example:
const reportCsv = {
  dataSource: {
    filename: "URL-to-your-CSV-file",
    fieldSeparator: ":"
  }
};
Set a CSV data source for all reports
To set a CSV data source for all reports, specify it in the Global Object:
<script setup>
  import {Pivot} from "@webdatarocks/vue-webdatarocks";
  import "@webdatarocks/webdatarocks/webdatarocks.css";

  const globalReportCsv = {
    dataSource: {
      type: "csv",
      filename: "URL-to-your-CSV-file"
    }
  };
  const reportCsv = {
    // Your report
  };
</script>

<template>
  <div>
    <Pivot
      v-bind:global="globalReportCsv"
      v-bind:report="reportCsv"
      toolbar
    />
  </div>
</template>
See also
This article explains how to define which data is shown on the grid using the Field List. Each field can be selected to rows, columns, values, or report filters.
To select the fields in the Field List
- Go to the Fields tab () on the Toolbar.
- Pay attention to the All Fields section on the left. It contains all fields from your data source.
- Drag and drop the fields to the Rows, Columns, Values, and Report Filters areas.
- To change the aggregation for a field in the Values box, press the Edit button (
 ) next to its name.
 - Use the Add calculated value button to compose new values based on your data source.
- Click the APPLY button to close the Field List and see the changes on the grid.
Try it yourself:
To show certain fields when loading data
- Configure your fields using the Field List.
- Save your current configuration and apply it when loading a new report. For more details, see Loading the report.
Want to check how is the field configuration defined in the report? Find the slice section in our online demo.
See also
Data type prefixes are added to field names in the first data record. Use the prefixes to set field data types.
Available prefixes
| Name | Description |
|---|---|
- | The field will be of the number type. |
+ | The field will be of the string type. |
d+ | The field will be a date divided into 3 subfields: Year, Month, Day. |
D+ | The field will be a date represented as a multilevel hierarchy with the following levels: Year > Month > Day. |
D4+ | The field will be a date represented as a multilevel hierarchy with the following levels: Year > Quarter > Month > Day. |
ds+ | The field will be a date displayed in the "dd/MM/yyyy" format. |
dt+ | The field will be a date displayed in the "dd/MM/yyyy HH:mm:ss" format. |
t+ | The field will be a time interval displayed in the "HH:mm:ss" format. |
m+ | The field will be of the month type. Natural sorting is applied to field members. |
w+ | The field will be of the weekday type. Natural sorting is applied to field members. |
Examples
1) Here is a sample CSV data where the ds+ and w+ prefixes are added to the field names:
ds+Invoice Date, Quantity, Country, w+Week Day
2018-05-15, 3, France, Tuesday
2018-05-16, 4, Italy, Wednesday
2018-05-17, 2, Spain, Thursday
2018-05-12, 2, Japan, Saturday
After loading the CSV data and selecting fields in the Field List, you can see that the Invoice Date is displayed as a string in the "dd/MM/yyyy" format, and the Week Day is interpreted as a day of the week:
2) You can represent a date as a multilevel hierarchy using the D+ or the D4+ prefix.
Here is an example with the D+ prefix:
D+Invoice Date, -Quantity, -Price, +Country
2018-05-15, 3, 329, France
2018-05-16, 4, 139, Italy
2018-05-17, 2, 429, Spain
2018-05-12, 2, 559, Japan
See how the Invoice Date is displayed in the pivot table when the CSV file is loaded to WebDataRocks:
This demo is also available on our CodePen.
To create multilevel hierarchies from fields of other types, refer to the Creating multilevel hierarchies guide.