Supported CSV format
In this guide, you can learn how to format your CSV data so WebDataRocks can process it.
CSV format
WebDataRocks supports the following CSV format:
- The first data record contains field names and optional data type prefixes.
- Each data record is on a separate line.
- Field names and values are separated by the same character: comma
,, semicolon;, or a custom field separator.
Here is an example of a valid CSV file:
Invoice Date, Quantity, Country, Week Day
2018-05-15, 3, France, Tuesday
2018-05-16, 4, Italy, Wednesday
2018-05-17, 2, Spain, Thursday
2018-05-12, 2, Japan, Saturday
Input value formats
Number field format
Number values can contain digits, -, and + characters. Point . must be used as a decimal separator. Numbers in exponential notation are also supported. Examples of valid values: -20, 2.50, 1.0E+2.
String field format
String values can be enclosed in double quotation marks or specified without them. If a field value contains line breaks or a field separator, it must be enclosed in double quotation marks. If a field is quoted, it must be escaped with double quotation marks. Examples of valid values: Apple, "A-Z" section, "1, 2, 3", "The ""A, B, C"" magazine".
Date field format
Date values must be specified in the ISO 8601 format. Examples: "2018-01-10" (date), "2018-01-10T08:14:00" (date and time), "2018-01-10T06:14:00Z" (date and time in UTC).
Time field format
Time values must be specified as a number of seconds. The component displays values in the "HH:mm:ss" format. Examples of valid values: 5400 (displayed as "01:30:00" in the component).
To ensure the detection of time values, set the field data type prefix to +t. Otherwise, they will be processed as numbers.
Month field format
Month values must start with a capital letter. Full names and 3-letter abbreviations of months are supported. Examples of valid values: "October", "Dec", "May".
To ensure the detection of month values, set the field data type prefix to +m. Otherwise, they will be processed as strings.
Weekday field format
Weekday values must start with a capital letter. Full names and 3-letter abbreviations of the days of the week are supported. Examples of valid values: "Monday", "Sun", "Friday".
To ensure the detection of weekday values, set the field data type prefix to +w. Otherwise, they will be processed as strings.
See also
Using the metadata object for JSON, you can create multilevel hierarchies from fields of any type.
In this guide, we’ll create a Food hierarchy with Category, Item, and Serving Size levels based on the data below:
[
  {
    "Category": "Breakfast",
    "Item": "Frittata",
    "Serving Size": "4.8 oz (136 g)",
    "Calories": 300
  },
  {
    "Category": "Breakfast",
    "Item": "Boiled eggs",
    "Serving Size": "4.8 oz (135 g)",
    "Calories": 250
  }
]
Step 1. In the metadata object, set the type of Category, Item, and Serving Size fields as "level":
[
  {
    "Category": {
      type: "level"
    },
    "Item": {
      type: "level"
    },
    "Serving Size": {
      type: "level"
    },
    "Calories": {
      type: "number"
    }
  },
  {
    "Category": "Breakfast",
    "Item": "Frittata",
    "Serving Size": "4.8 oz (136 g)",
    "Calories": 300
  },
  {
    "Category": "Breakfast",
    "Item": "Boiled eggs",
    "Serving Size": "4.8 oz (135 g)",
    "Calories": 250
  }
]
Step 2. Use the hierarchy, parent, and level properties of the metadata object to create the Food hierarchy:
[
  {
    "Category": {
      type: "level",
      hierarchy: "Food"
    },
    "Item": {
      type: "level",
      hierarchy: "Food",
      level: "Dish",
      parent: "Category"
    },
    "Serving Size": {
      type: "level",
      hierarchy: "Food",
      level: "Size",
      parent: "Dish"
    },
    "Calories": {
      type: "number"
    }
  },
  {
    "Category": "Breakfast",
    "Item": "Frittata",
    "Serving Size": "4.8 oz (136 g)",
    "Calories": 300
  },
  {
    "Category": "Breakfast",
    "Item": "Boiled eggs",
    "Serving Size": "4.8 oz (135 g)",
    "Calories": 250
  }
]
See how this dataset will be visualized in WebDataRocks:
Check out a live demo on CodePen.
See also
The metadata object is used for setting data types, creating multilevel hierarchies, and changing captions. This object is specified as the first element of the JSON array.
Properties
| Name | Type | Description |
|---|---|---|
type | String | optional The field’s data type. Possible values:
|
caption | String | optional The field’s caption. |
hierarchy | String | optional The name of the hierarchy. Used for multilevel hierarchies. Set this property to make the field a level of the specified hierarchy. In this case, the type must be set to "level". |
parent | String | optional The caption of the parent hierarchy level. Used for multilevel hierarchies. In this case, the type must be set to "level". |
level | String | optional The caption of the hierarchy level. Used for multilevel hierarchies. In this case, the type must be set to "level". |
Examples
1) Setting the metadata object in a JSON array of objects:
[
  {
    "Product": {
      "type": "string"
    },
    "Price": {
      "type": "number"
    }
  },
  {
    "Product": "Apple",
    "Price": 2.50
  },
  {
    "Product": "Cherry",
    "Price": 5.25
  }
]
See the full example on CodePen.
2) Setting the metadata object in a JSON array of arrays:
[
  {
    "Product": {
      "type": "string"
    },
    "Price": {
      "type": "number"
    },
  },
  ["Apple", 2.50],
  ["Cherry", 5.25]
]
Try a live demo on CodePen.
See also
- Supported JSON formats
- Setting data types
- Connecting to JSON
- Creating multilevel hierarchies in JSON
Use the drill-down feature to drill into the different levels of a hierarchy. This operation helps to reveal more details of your data and get a more specific view of the hierarchies. Drill back up when you need to get a general view of the data.
Example
Starting from a country level, drill down to a city level that can be further drilled down to an address level. Drill up the levels to return to the previous view of the hierarchy.
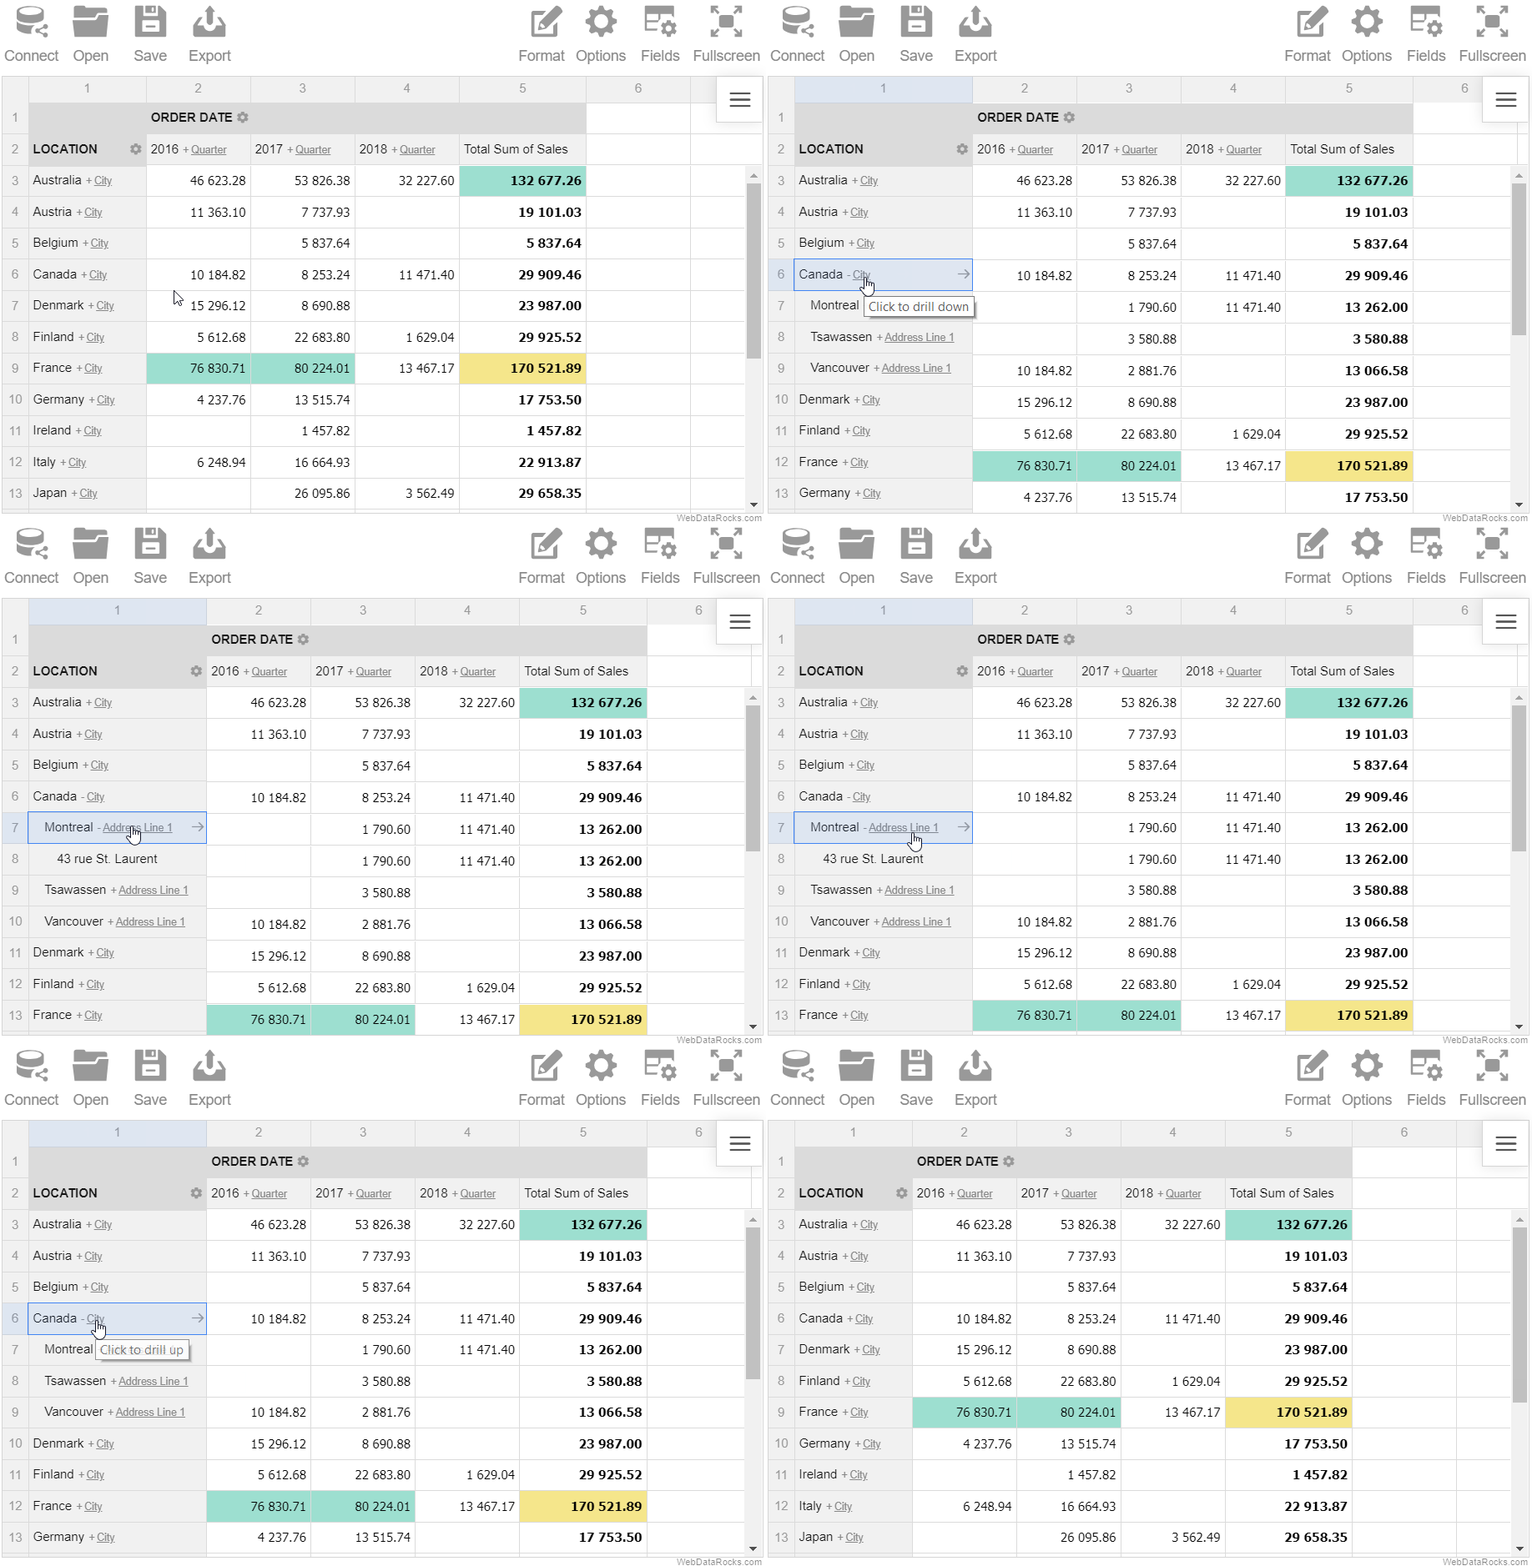
Note. This feature can be used only with the multilevel hierarchies. Refer to the Data types guide for details on how to define levels in the data types.
Use the drag-and-drop feature to organize and restructure your report in real time.
Example
Drag and drop the hierarchies between the rows, columns and report filters right on the grid.
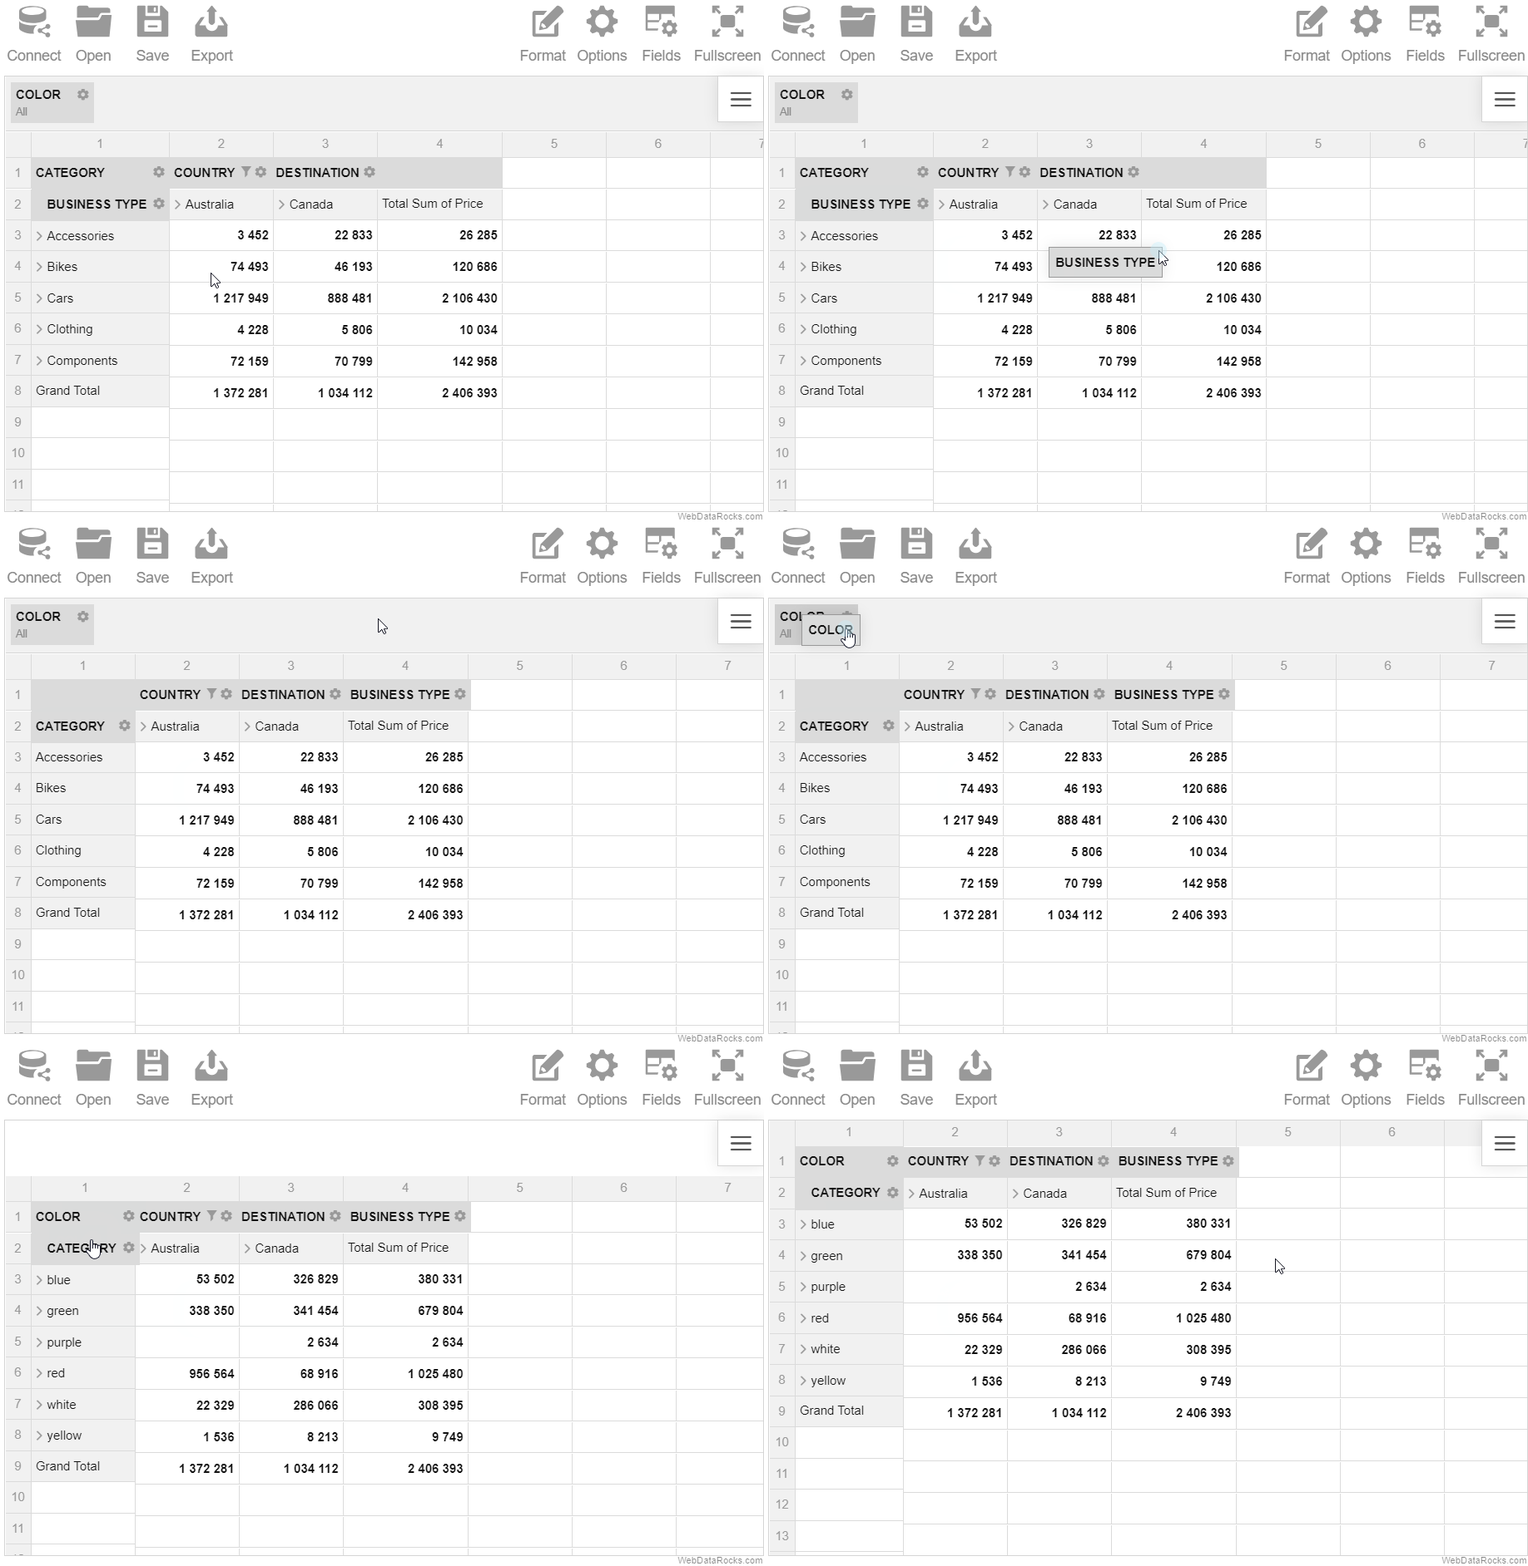
Use the expand and collapse operations to analyze the data on different levels of detail.
Example
Expand the Category hierarchy to display the members of the next (Business Type) hierarchy.
In a classic form:
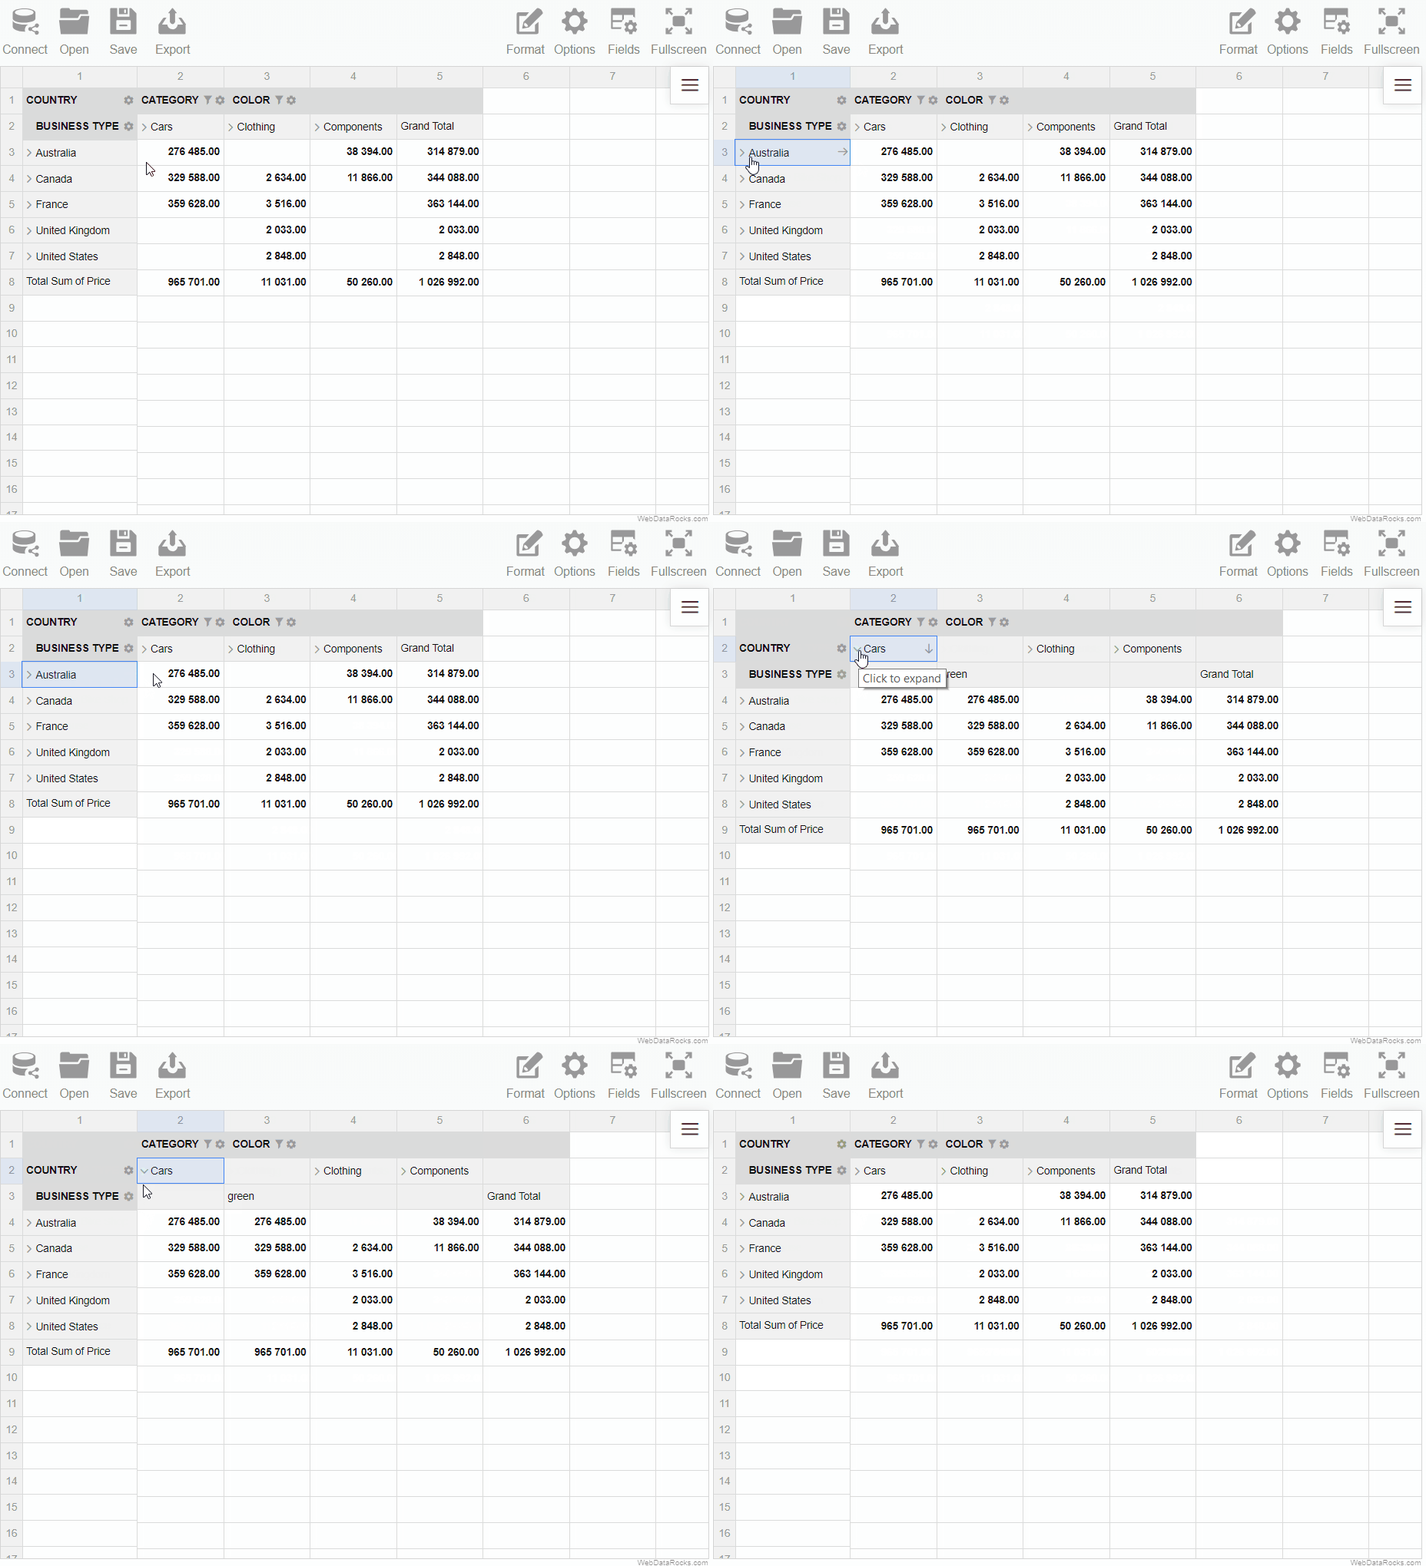
In a compact form:
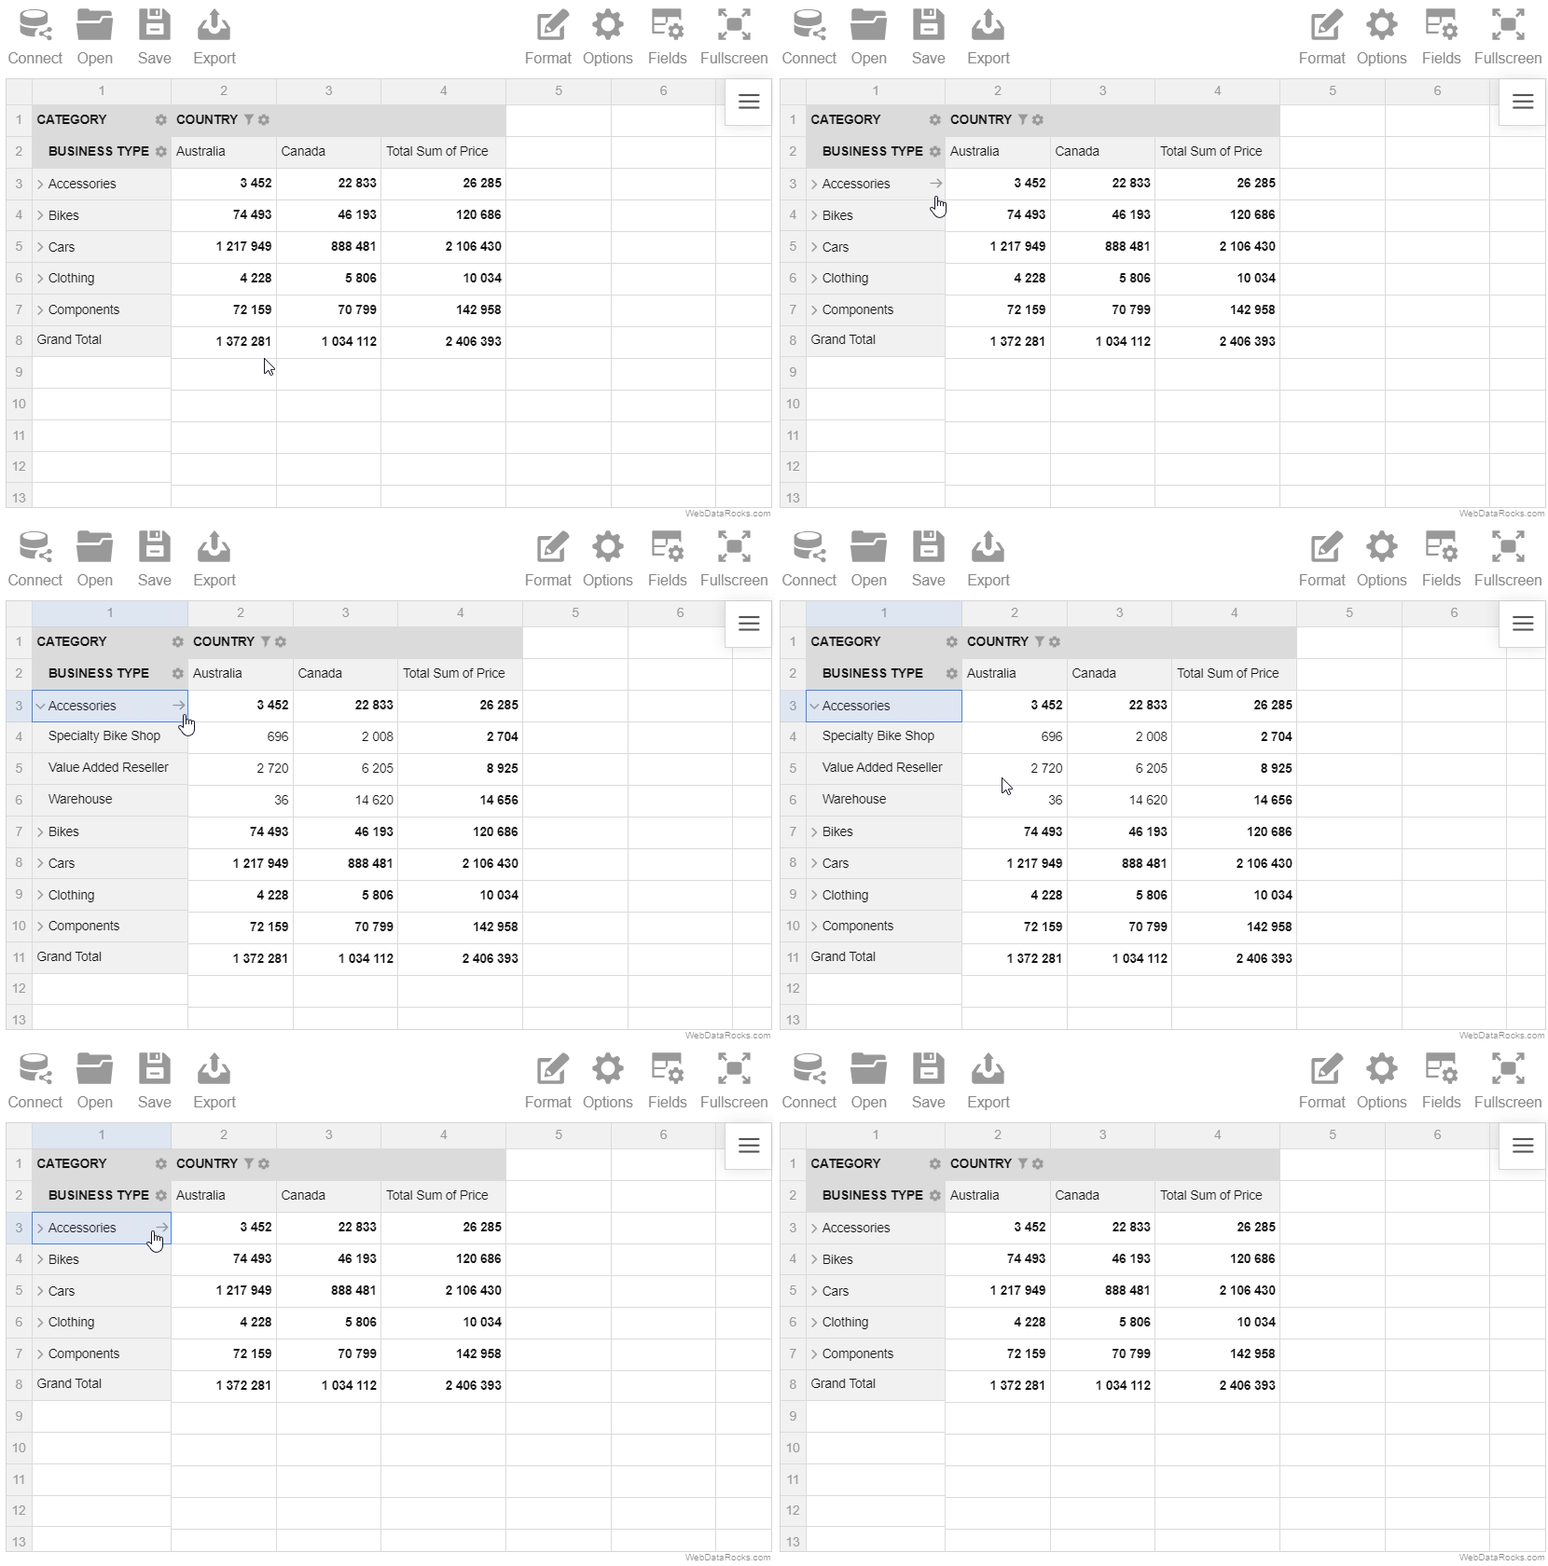
The main idea of the calculated values lies in giving a more complete picture of your data by measuring your data in a custom way.
To create a calculated value, define an expression on which the values are calculated and apply it to your data. It serves as a new aggregation function that you can change or delete at any moment.
Moreover, multiple calculated values can be created within one report.
To add a calculated value
- Go to the Fields tab () on the Toolbar.
- Click the Add calculated value button.
- Type in the name of a formula in the input field.
- Choose the fields to include in the formula, the aggregation functions to apply to these fields, and add the necessary operators.
- Apply the changes.
NOTE: the Count and Unique Count functions can be applied only to the string fields.
Example
Let’s define a new Revenue measure. It is composed of Price and Quantity fields (Price * Quantity).
- Type in a name of a new calculated value.
- Drag the fields to the Formula area and add a multiplication operator to compose a product of two values.
- Apply the changes. Now the new calculated value is placed at the bottom of the list. Drop it to the Values area to add it to the report.
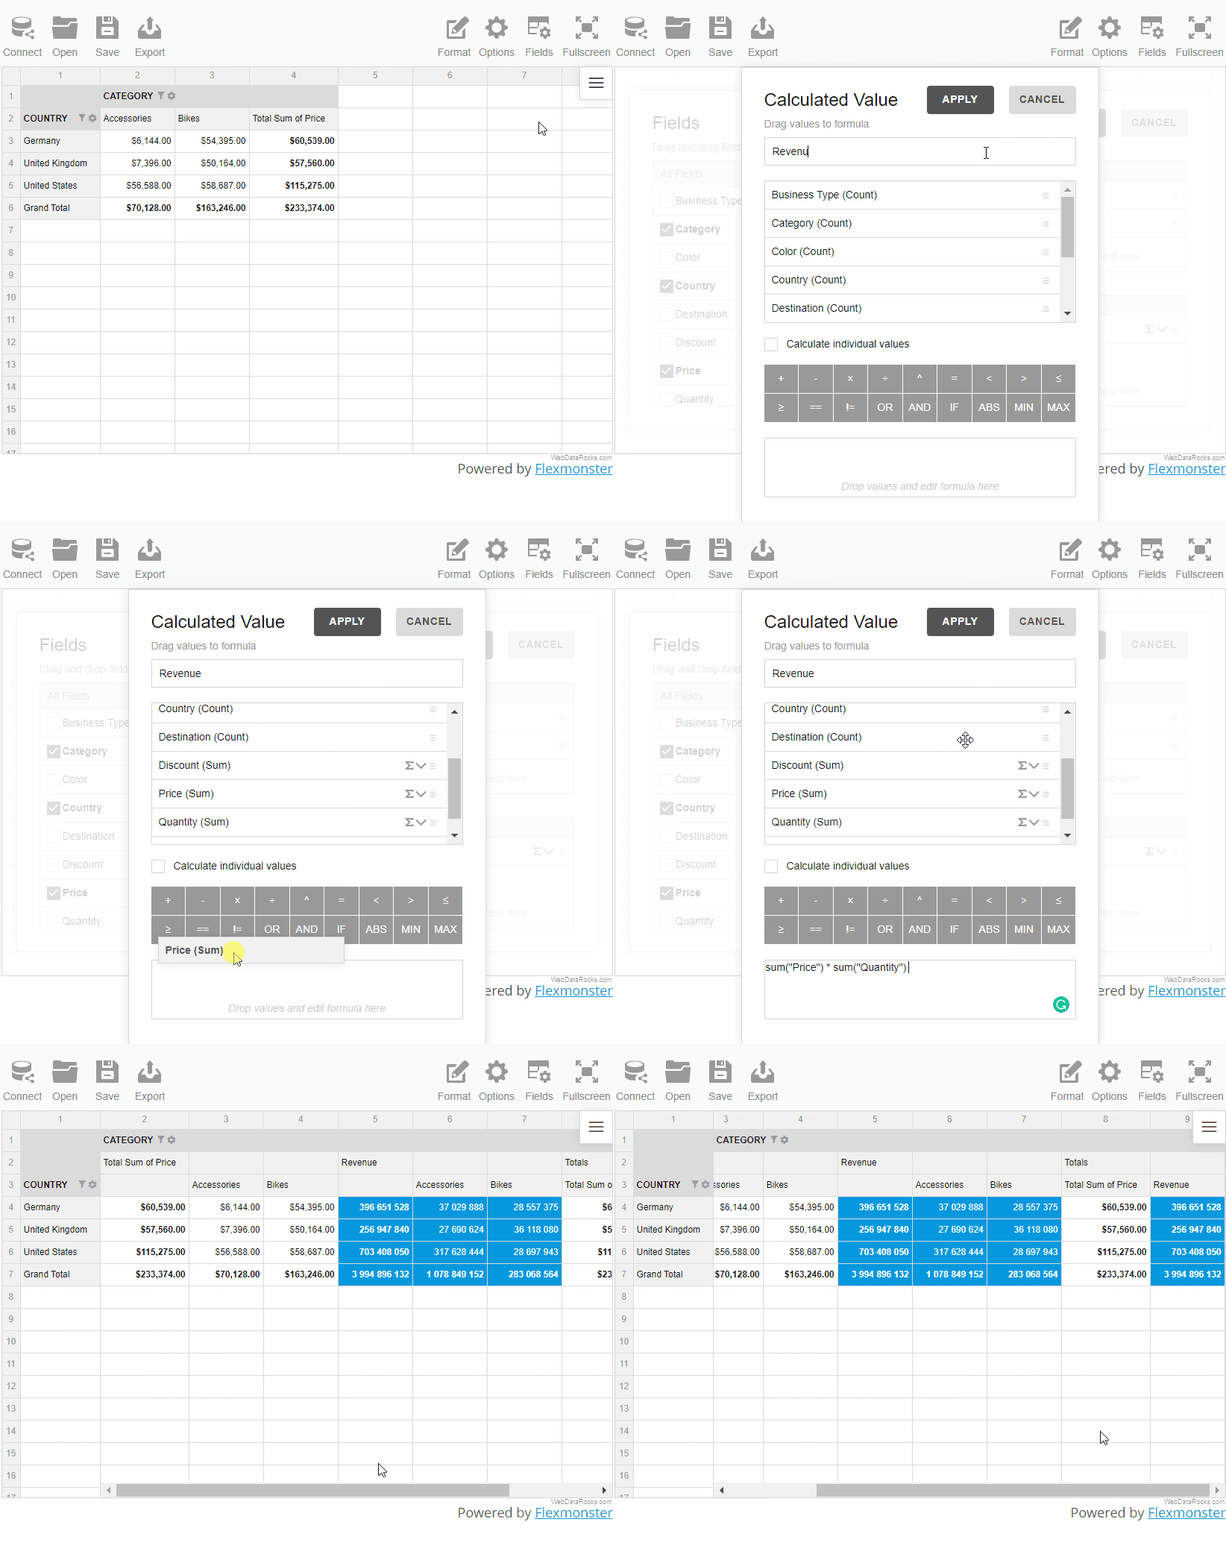
All calculated values are saved in the measures of the report’s slice.
To edit a calculated value
- Go to the Fields tab () on the Toolbar.
- Find the calculated value in the All fields box.
- Click the Sigma editing button (
 ) next to the value’s name.
 - Edit the calculated value.
- Apply the changes.
To remove a calculated value
- Go to the Fields tab () on the Toolbar.
- Find the calculated value in the All fields box.
- Click the Sigma editing button (
 ) next to the value’s name.
 - Click the Remove button (✕).
- Confirm the action.
Individual values
Note that there is the Calculate individual values checkbox. If it is checked, the formula is calculated based on the raw values. Otherwise, it is calculated using the aggregated values.
Find out the difference between the calculated and calculated individual values in the demo.
We hope your time using WebDataRocks Pivot Table has been productive and satisfying. WebDataRocks provides all the basic features for data visualization and analysis, such as connecting to JSON or CSV data sources and essential data aggregation functions.
In case you want to have more features, be it advanced customization or more data source options, we recommend looking at Flexmonster Pivot Table & Charts — a commercial advanced component developed by the same team.
Flexmonster has all of the WebDataRocks features and more, so you have nothing to lose by migrating to it. In addition, the number of changes required to move from WebDataRocks is minimal.
Continue with this page to discover all the Flexmonster features your project can benefit from👇
No data size limit
WebDataRocks works with JSON and CSV datasets no larger than 1 MB, which should satisfy the majority of use cases.
Flexmonster doesn’t set limits on the dataset’s size, so the maximum size depends only on the browser’s capabilities. Moreover, Flexmonster can connect to server-side data storage and load only the necessary data subsets into the browser, allowing you to work with much larger datasets.
More data source options
In addition to having no strict limit on the data size, Flexmonster offers a wider selection of data sources.
The following data sources are supported out of the box:
- JSON
- CSV
- Microsoft Analyses Services
- SQL databases
- Elasticsearch
- MongoDB
You can also connect Flexmonster Pivot to any data source using the custom data source API — Flexmonster’s communication protocol that helps you build a custom data source using your server.
See the full list of the data sources supported by Flexmonster.
Built-in pivot charts
Flexmonster offers one more exclusive feature — built-in pivot charts. This allows you to visualize data using the charts out of the box without integrating with third-party charting libraries.
Check out the video that shows how to work with Flexmonster Pivot Charts:
Advanced customer support
Another important aspect of Flexmonster is Rockstar Support — a team of technical specialists who are always ready to answer your questions or help you resolve issues. You can also check out the collection of resolved support tickets to find a solution for your case.
Other benefits
In addition to everything listed, Flexmonster provides other benefits:
Where do I start with Flexmonster?
Flexmonster offers a 30-day free trial requiring no payment details, so you can test Flexmonster’s functionality and decide whether it fits your project. Moreover, you can get a special discount as a WebDataRocks user if you decide to buy the product license.
To smoothly move from WebDataRocks to Flexmonster, check out our migration guide.
If you want to see Flexmonster in action, watch this video for a detailed overview of Flexmonster Pivot and then try out the live demo:
In this guide, you can learn how to format your JSON data so WebDataRocks can process it.
JSON formats
WebDataRocks supports two JSON formats:
1) Array of objects. Each object is an unordered collection of key-value pairs, where the key is a field name and the value is a field member. Example:
[
  {
    "Product": "Apple",
    "Price": 2.50
  },
  {
    "Product": "Cherry",
    "Price": 5.25
  }
]
2) Array of arrays. The first subarray contains field names, while the other subarrays contain the respective field members. The field’s name and members must have the same position in the subarrays. Example:
[
  ["Product", "Price"],
  ["Apple", 2.50],
  ["Cherry", 5.25]
]
Regardless of what JSON format you choose, the first element of each array can be the metadata object for JSON. This object is used to set data types and create multilevel hierarchies.
Input value formats
Number field format
Number values can contain digits, -, and + characters. Point . must be used as a decimal separator. Numbers in exponential notation are also supported. Examples of valid values: -20, 2.50, 1.0E+2.
String field format
String values must be enclosed in double quotation marks. Special characters, such as line breaks or double quotation marks, must be escaped using the backslash. Examples of valid values: "Apple", "\"A-Z\" section".
Date field format
Date fields must be defined in one of the following formats:
- ISO 8601. Examples:
"2018-01-10"(date),"2018-01-10T08:14:00"(date and time),"2018-01-10T06:14:00Z"(date and time in UTC). - Unix timestamps in milliseconds. Examples:
1515535200000(timestamp of the"2018-01-10"date),1515564860000(timestamp of the"2018-01-10 08:14:20"date and time).
Note. By default, Unix timestamps are interpreted in WebDataRocks as numbers. To use them as dates, explicitly set the type property in the metadata object to the needed date type. - JavaScript Date objects. Can be used only with inline JSON data. Examples:
new Date(2018, 0, 10)(creates the"2018-01-10"date),new Date("January 10, 2018 08:14:20")(creates"2018-01-10 08:14:20"date and time).
Note. In the array of arrays, JavaScript Date objects are interpreted in WebDataRocks as strings. To use them as dates, explicitly set the type property in the metadata object to the needed date type.
Time field format
Time values must be specified as a number of seconds. The component displays values in the "HH:mm:ss" format. Example: 5400 (displayed as "01:30:00").
To ensure the detection of time values, set the field type to "time" in the metadata object. Otherwise, they will be processed as numbers.
Month field format
Month values must start with a capital letter. Full names and 3-letter abbreviations of months are supported. Examples: "October", "Dec", "May".
To ensure the detection of month values, set the field type to "month" in the metadata object. Otherwise, they will be processed as strings.
Weekday field format
Weekday values must start with a capital letter. Full names and 3-letter abbreviations of the days of the week are supported. Examples: "Monday", "Sun", "Friday".
To ensure the detection of weekday values, set the field type to "weekday" in the metadata object. Otherwise, they will be processed as strings.
See also
- Setting data types
- Connecting to JSON
- Creating multilevel hierarchies in JSON
- Metadata object for JSON
What is WebDataRocks
WebDataRocks is a free web reporting tool for data analysis and visualization.
It is written in JavaScript and is not constrained by any external framework. This simple but enterprise-featured web-based pivot grid can be added to your website, application, or project web page within minutes.
What does it offer
WebDataRocks easily displays your CSV or JSON data in an interactive pivot table, offers a number of data analysis features, and provides a reporting experience. You get real-time reporting of your data on any device you prefer (PC, tablet, mobile, etc.)
Who can use WebDataRocks
Our reporting tool would be a perfect fit if you:
- Want to analyze data quickly.
- Are looking for an online reporting tool.
- Need a lightweight web pivot table.
- Don’t know how to code or don’t want to.
Why is it cool
- WebDataRocks easily embeds in your web page not requiring much programming skills.
- You can save your time and expenses on integration as it’s already configured and ready to use.
- Our tool has enterprise features for a real business, despite being costless.
- It’s a powerful analytic tool with a well-designed ready-to-use modern UI.
The main benefit is that WebDataRocks is an absolutely free tool created by passionate data lovers from Flexmonster.
How can I get WebDataRocks and add it to my project
To make it simple for you we’ve prepared an integration tutorial that provides you with easy instructions on how to download WebDataRocks and add it to your website or application.
How can I use more advanced options
For those of our users who want to further explore WebDataRocks functionality, we prepared guides on the following topics:
- Custom report themes
- Localization
- Integration with frameworks
- Integration with charting libraries (amCharts, Highcharts, Google Charts, and FusionCharts)
- List of API methods and objects
Some thoughts from creators
We truly hope that you will enjoy all this experience with WebDataRocks. It’s created to help solve data analysis needs for different kinds of projects: start-ups, nonprofit, or commercial. So, if it will work for you, please share your success with others. Let data rock this world!
License
By downloading, installing, and/or using WebDataRocks, you agree with the terms of WebDataRocks End User License Agreement.