The Toolbar
Our reporting tool comes with the Toolbar, which gives you access to the most useful features. This article explains how to use the Toolbar.
Show the Toolbar
By default, the Toolbar is hidden in WebDataRocks.
To show the Toolbar, specify the [toolbar]="true" property when creating a WebDataRocks instance:
<app-wbr-pivot
 [toolbar]="true">
</app-wbr-pivot>
Hide the Toolbar
If you want to display the component without the Toolbar, you can remove [toolbar]="true" from your code or set the toolbar property to "false":
<app-wbr-pivot
 [toolbar]="false">
</app-wbr-pivot>
Available functionality
The Toolbar contains the following tabs:
| Connect | Allows connecting to your JSON or CSV data source. Has a drop-down menu with the following tabs: To local CSV, To local JSON, To remote CSV, and To remote JSON. |
| Open | Allows opening locally or remotely saved reports. Has a drop-down menu with the following tabs: Local report and Remote report. |
| Save | Saves your current report configuration into a local JSON file. |
| Export | Allows printing the current report or exporting it into various formats. Has a drop-down menu with the following tabs: Print, To HTML, To Excel, and To PDF. |
| Format | Allows printing the current report or exporting it into various formats. Has a drop-down menu with the following tabs: Format cells and Conditional formatting. |
| Options | Opens the Layout options pop-up window, where you can show/hide totals or switch between the classic, compact, and flat forms. |
| Fields | Opens the Field List, where you can select which data is shown in rows, columns, measures, and report filters. |
| Fullscreen | Switches WebDataRocks between the fullscreen and windowed mode. You can also exit fullscreen by pressing Esc. |
Specifics of the Toolbar on mobile devices
If you are using WebDataRocks on a mobile device, the mobile version of the Toolbar with a different set of tabs will be shown. For example, instead of the Connect tab, you will see CSV and JSON tabs for loading remote data. Local files cannot be used.
To switch to the desktop Toolbar version on your mobile device, you can request the desktop site in the browser settings.
Adjust the Toolbar to your needs
You can customize the standard view and functionality of the Toolbar (e.g., add new tabs or remove the ones you don’t need). If you are interested in such an option, follow this tutorial: Customize the Toolbar.
See also
Our reporting tool comes with the Toolbar, which gives you access to the most useful features. This article explains how to use the Toolbar.
Show the Toolbar
By default, the Toolbar is hidden in WebDataRocks.
To show the Toolbar, specify the toolbar={true} prop when creating a WebDataRocks instance:
<WebDataRocksReact.Pivot
  toolbar={true}
/>
Hide the Toolbar
If you want to display the component without the Toolbar, you can remove toolbar={true} from your code or set the toolbar prop to {false}:
<WebDataRocksReact.Pivot
  toolbar={false}
/>
Available functionality
The Toolbar contains the following tabs:
| Connect | Allows connecting to your JSON or CSV data source. Has a drop-down menu with the following tabs: To local CSV, To local JSON, To remote CSV, and To remote JSON. |
| Open | Allows opening locally or remotely saved reports. Has a drop-down menu with the following tabs: Local report and Remote report. |
| Save | Saves your current report configuration into a local JSON file. |
| Export | Allows printing the current report or exporting it into various formats. Has a drop-down menu with the following tabs: Print, To HTML, To Excel, and To PDF. |
| Format | Allows printing the current report or exporting it into various formats. Has a drop-down menu with the following tabs: Format cells and Conditional formatting. |
| Options | Opens the Layout options pop-up window, where you can show/hide totals or switch between the classic, compact, and flat forms. |
| Fields | Opens the Field List, where you can select which data is shown in rows, columns, measures, and report filters. |
| Fullscreen | Switches WebDataRocks between the fullscreen and windowed mode. You can also exit fullscreen by pressing Esc. |
Specifics of the Toolbar on mobile devices
If you are using WebDataRocks on a mobile device, the mobile version of the Toolbar with a different set of tabs will be shown. For example, instead of the Connect tab, you will see CSV and JSON tabs for loading remote data. Local files cannot be used.
To switch to the desktop Toolbar version on your mobile device, you can request the desktop site in the browser settings.
Adjust the Toolbar to your needs
You can customize the standard view and functionality of the Toolbar (e.g., add new tabs or remove the ones you don’t need). If you are interested in such an option, follow this tutorial: Customize the Toolbar.
See also
You can change the default number formatting of the report. WebDataRocks offers many options for formatting your numerical data such as:
- Align of the text
- Thousand and decimal separators
- Quantity of decimal places
- Currency symbols
- Currency align
- Null (default) value
- Percent formatting
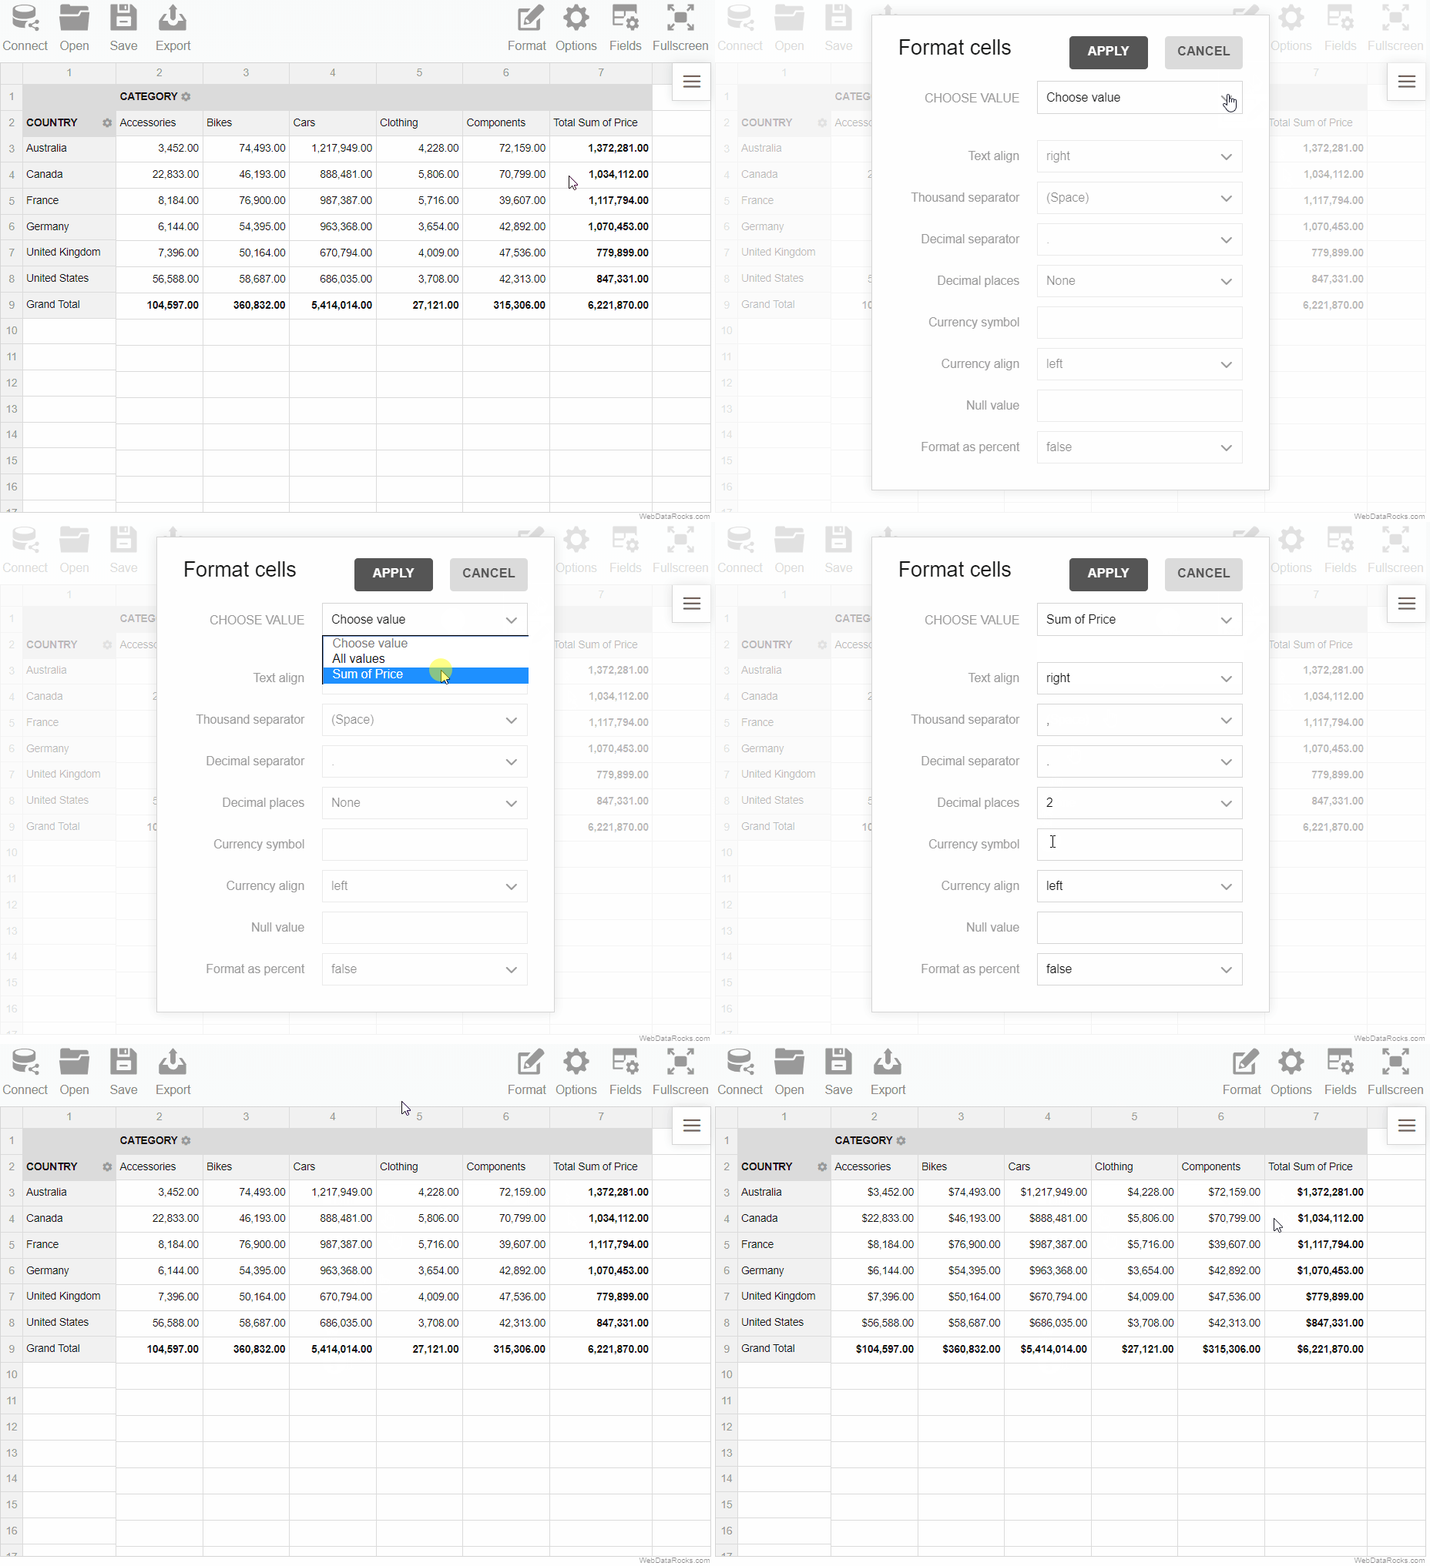
To format numbers
- Go to the Format tab () on the Toolbar.
- Select Format cells.
- Select the value which formatting should be changed.
- Set the properties of formatting.
- Apply the changes.

Use the drill-through feature to see from which non-aggregated records the value in the cell is composed.
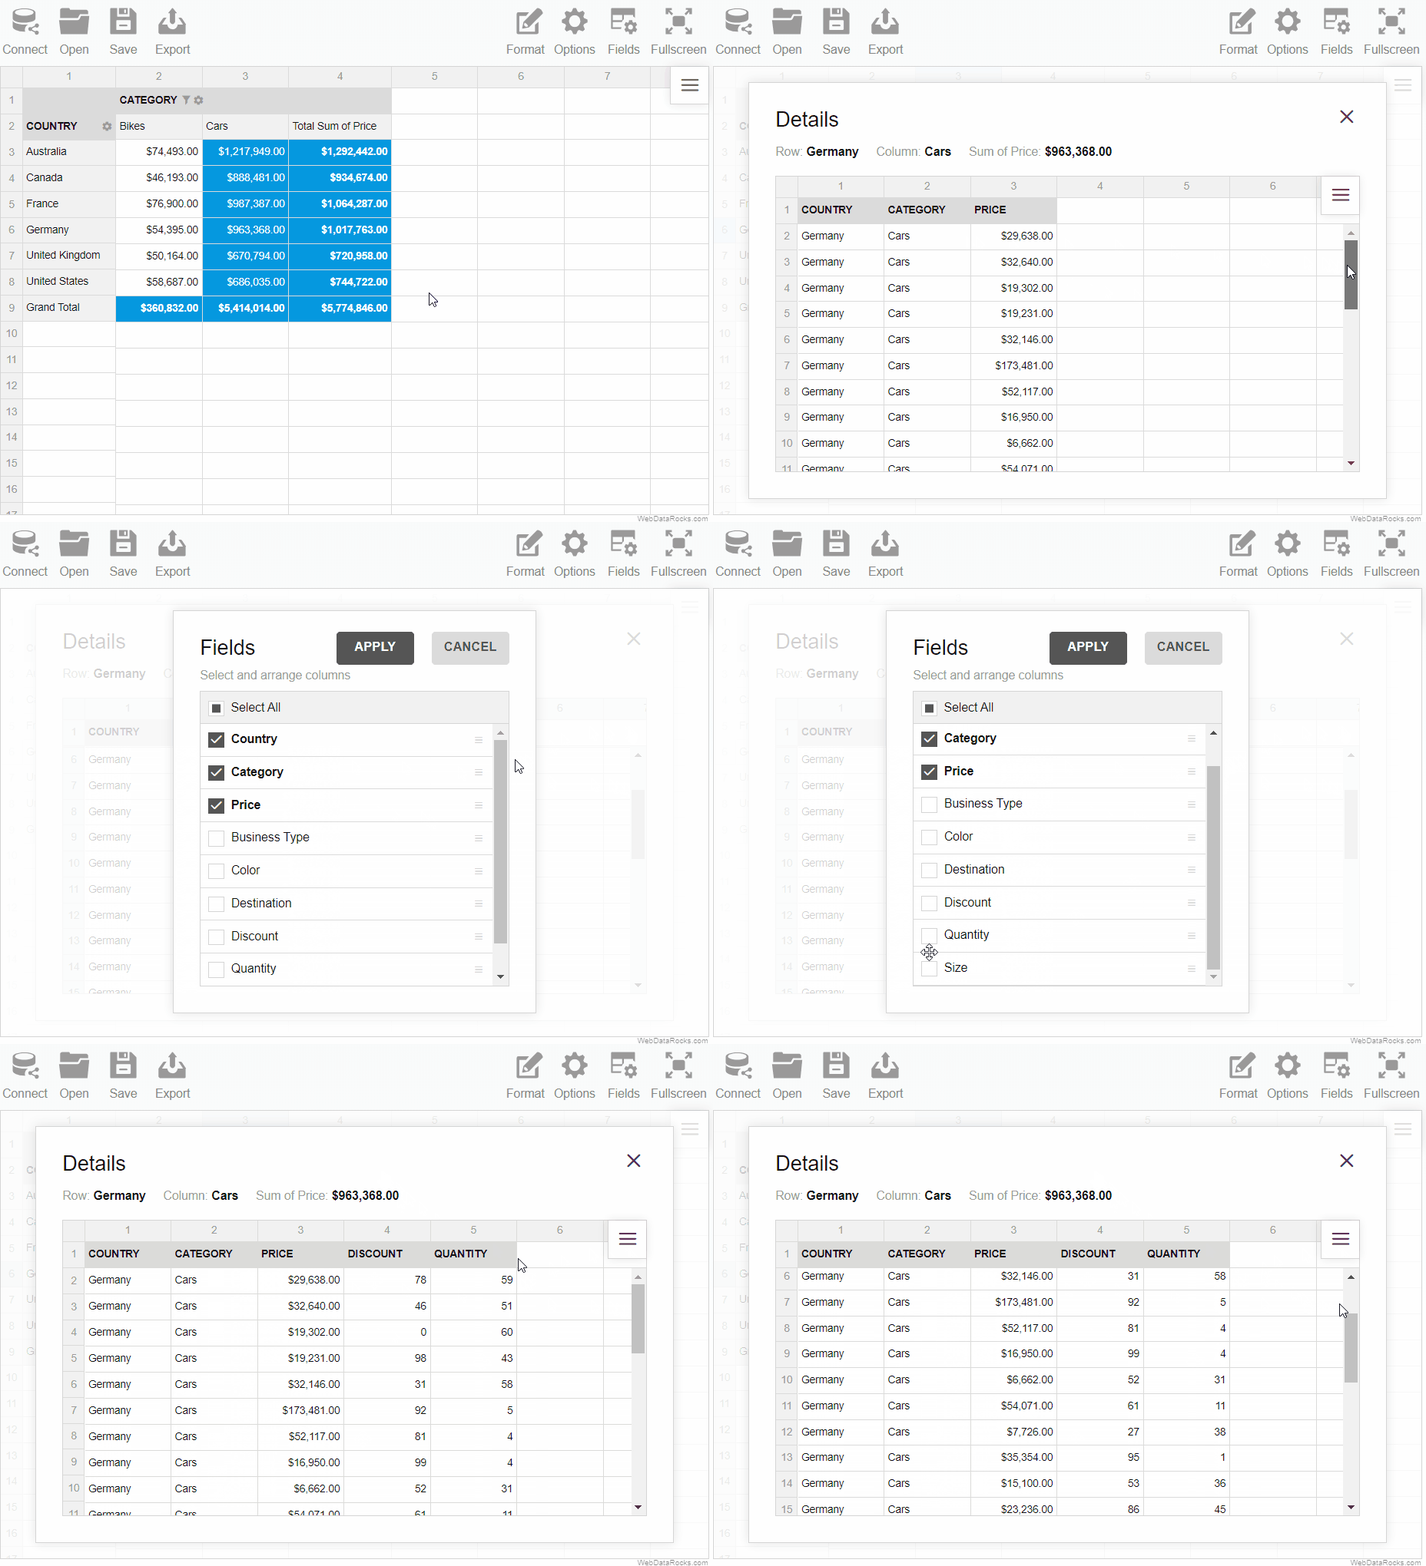
To drill through the cell
- Double-click the cell.
- Look through all the information about the cell in the drill-through pop-up window.
To specify what information to show in the drill-through view, open the Field List (![]() ).
).
Note that if you change the values in the drill-through pop-up window, the changes are not applied to the values from the initial grid. They are “view-only”.

Aggregation functions group together values from multiple fields to form a single compound value. To choose an aggregation function for a value, use the Field List.
WebDataRocks Pivot Table offers 17 aggregation functions, which you can apply to the measures in your report:
| Name | Value | Description |
|---|---|---|
| Sum | "sum" | Adds all values in the row/column |
| Count | "count" | Counts the number of the rows/columns that contain values |
| Distinct Count | "distinctcount" | Counts the number of the rows/columns that contain unique values |
| Average | "average" | Returns the average (arithmetic mean) of the values in the row/column |
| Median | "median" | Returns the median of the values in the row/column |
| Product | "product" | Multiplies the values in the row/column |
| Min | "min" | Returns the smallest number in the row/column |
| Max | "max" | Returns the largest value in the row/column |
| % of Grand Total | "percent" | Calculates the values distribution across grand totals in the report |
| % of Column | "percentofcolumn" | Calculates the percent distribution across the columns |
| % of Row | "percentofrow" | Calculates the percent distribution across the rows |
| Index | "index" | Calculates the aggregated weighted average to reveal the impact of each value within the context of a dataset |
| Difference | "difference" | Calculates the difference between two values in the row/column |
| % Difference | "%difference" | Calculates the difference between two values in the row/column expressed in percentages |
| Population Standard Deviation | "stdevp" | Calculates population standard deviation of the values in the row/column |
| Sample Standard Deviation | "stdevs" | Calculates sample standard deviation of the values in the row/column |
| Running Totals | "runningtotals" | Calculates running totals (cumulative sum) |