List of best JavaScript components for report application
In this article
Explore the best JavaScript components for building robust report applications. This article covers top libraries like Chart.js, amCharts, Apache ECharts, D3.js, and more, comparing their features, pros, and cons to help you find the right data visualization and reporting tools for your business needs.
The right choice of web reporting tool can be a crucial factor for any data-driven business. Software development is a truly complex process that requires managing and coordinating many different modules and components for a reporting solution to work flawlessly. So in this article, we decided to dive into the exciting world of JavaScript libraries and components for report applications, web reporting tools, or software with reporting elements and created a collection of the best JavaScript libraries for report applications.
Dev components for report applications
When developing a functional and convenient web-based reporting and visualization tool it’s important to pay attention to all possible data visualization tools. There are plenty of them:
- charts,
- tables,
- pivots,
- maps,
- graphics,
- kanbans,
- calendars and more.
You need to be aware that there are no universal tools for everyone and every application. Not only do components come in various categories, such as paid and free, open-source and non-open-source, and universal or framework-specific (like React or Angular), but the choice depends on your business needs. So understanding the functionality and features of different JavaScript controls will help you to select the most suitable tool for managing and visualizing your business data.
In this article, we tried simplifying your decision-making process by reviewing our favorite data visualization web components.
Charts
Charts are truly iconic visualization that everyone should have. Simply because these figures are much more understandable and can reveal some even hidden insights within the data.
Chart.js
Chart.js is an open-source and freely available web reporting tool found on GitHub that enables you to use the HTML5 canvas feature. It offers a user-friendly experience and remarkable flexibility, allowing rich customization. With Chart.js, you can define styles, legends, fonts, animations, and chart behavior according to your needs.
The product has a large, strong community and was built from the hard work of a lot of contributors. Chart.js integrates with most modern technologies and has detailed documentation. Besides that:
Pros
- 8 types of charts and graphs: Line, Linear with Areas, Bar, Pie, Radar, Polar, Bubble and Scatterplot (Scatter).
- All types are responsive when working on the web and can be animated.
- The functionality can be extended through the use of plugins.
- IE11+ browser support.
- Big community. A lot of information, posts, tutorials on StackOverflow, and other resources.
Cons
- Don’t support advanced chart types such as heat maps or network diagrams
- Can have performance issues with large datasets

Chart.js is a simple and stylish app development tool, perfect for those who need a simple solution and don’t require an extensive range of chart options.
amCharts
amCharts – is a high-level JavaScript library for interactive data visualization. This library provides many different types of charts, including interactive maps and Gantt charts.
Its main features are:
- the ability to analyze data “in-depth” (drill-down) and other well-developed interactive options,
- well-written documentation describing all the necessary methods,
- awesome graphs animation,
- integration with React, Angular, Vue, Ember, and ready plugins for WordPress,
- “Live” graphics, full customization, and accessibility in accordance with W3C standards.
Cons
- Price. There are free and commercial licenses. The commercial licenses can be really expensive
- Can be hard for beginners.

Apache ECharts
If you are looking for a free, super powerful visualization library, then Apache ECharts is your choice because it is one of the best JavaScript charting libraries. It’s based on zrender, which is a whole new lightweight canvas library.
In fact, you just need to browse their page and see all the examples of what you can create. This is not the easiest library to work with – but if you need powerful, complex visualization, you are in the right place.
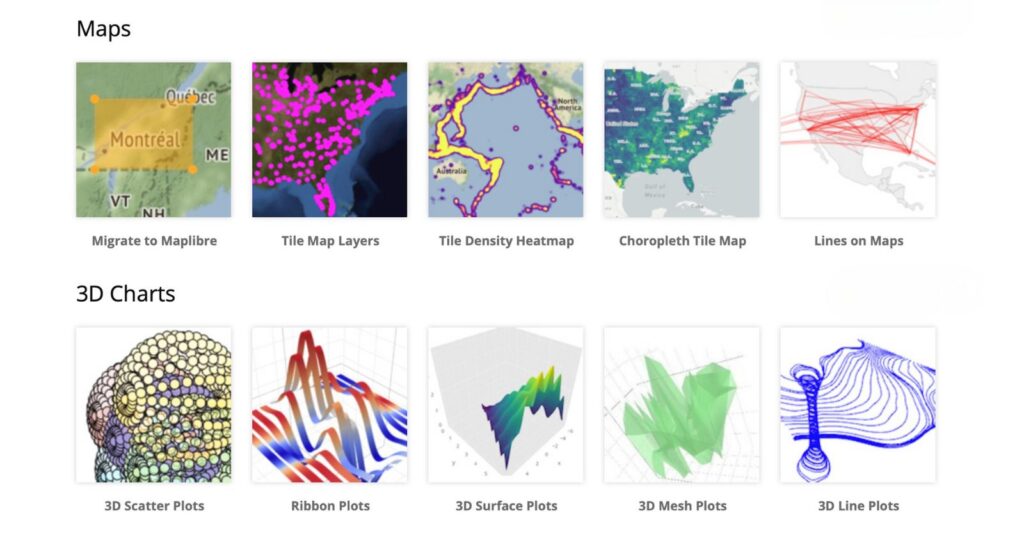
Apache ECharts provides more than 20 kinds of charts as well as maps and 3D charts, along with a dozen components, and each of them can be arbitrarily combined to use.
- Easily switch between Canvas and SVG rendering.
- Accessibility-Friendly.
- Support data transforms like filtering, clustering, and regression to help analyze multi-dimensional data.
- High performance
- Powerful declarative API for customizing and theming charts
- An active international community that contributes a wealth of third-party extensions.
According to the last point, there are a lot of forks on Github with different components based on this library. Take a look at this example for the Vue.js framework.
D3.js and C3.js
D3 is more than just a library it’s more like a framework that follows a data-driven approach to DOM manipulation than a library.
Working with D3 can beinitially challenging, but its ability to create stunning original renderings and any graphics from scratch makes D3 a worthwhile tool.
Furthermore, there are tons of platforms and tutorials available, such as Observable, to explore and learn from.
Most of the other charting libraries are built on the D3. One of them is C3.js – a reusable chart library that makes it easy to generate D3-based charts by wrapping the code required to construct the entire chart. It’s quite a customizable library that provides a variety of APIs and callbacks to update the chart even after it’s rendered.
In addition, there are many components that are designed specifically for a particular framework and are sharpened for its features. Here is some for them:
- React-vis – a special React visualization library,
- visx – a collection of reusable low-level data visualization components based on React and D3,
- vue-d3-network – Vue component to graph networks using d3-force,
- nivo – a rich set of data visualization components, also built on top of D3 and React libraries.
Plotly.js
offers an impressive collection of over 40 chart types, including complex visualizations like 3D charts, contour plots, heatmaps, and specialized statistical and financial graphs. Its universal architecture allows it to serve as the browser-based visualization engine for Plotly’s libraries in Python, R, and MATLAB.
Pros:
- Huge variety of chart types
- excellent interactivity
- strong scientific focus
- free and open-source under the MIT license
Cons:
- Heavier bundle size than Chart.js
- can be complex to configure initially.
Data tables
Tables are the minimal data structuring, which in fact is also a visualization. Tables are easier to read, easier to search in, and easier to display than charts or maps.
AG Grid
Ag-Grid is a convenient and functional JavaScript grid component. The internal mechanism is implemented in TypeScript with zero dependencies.
Many of the features greatly simplify the process of creating applications:
- It works with all major frameworks and web platforms,
- grouping data,
- a large set of built-in filters,
- the ability to create your own cell editors,
- complex sorting of large databases,
- real-time data update,
- and lots of customization options.
Cons
- Troubles with integration with third-party libraries
- Hard for big projects

ReactDataGrid
Enterprise-grade React Data Grid component that provides a lot of features: sorting, paging, filtering, grouping, locked columns, context menu, row details and many more. This grid component was developed specifically with React ensuring seamless integration and optimal performance.
Pros:
- Pivoting
- Live pagination
Cons:
- For small projects

Adazzle
Feature-rich and customizable data grid React component. Seamlessly integrating with other React components and libraries, offers big set of features including sorting, filtering, grouping, virtual scrolling, cell editing, and numerous others.
Pros:
- Excel-like feature set

Wijmo’s FlexGrid
FlexGrid for WinForms is a powerful and flexible data grid control provided by ComponentOne, a part of GrapeCity. Control is packed with basic as well as advanced features like in-cell editing, sorting, filtering, merging, grouping, and much more.
- Pivot
- Charts
- Export in PDF, Excel, CSV, HTML
Cons
- Hard for beginners
- Price

DataTableDEV
DataTableDev is a new library for the instant display of massive datasets. All main manipulations with data like scrolling, searching, or filtering are entirely smooth and intuitive, with immediate results and no delays at all. All your data is right in front of you, ready to be discovered, with immediate access to every record.
- Promising demo (allows you to test the approach on a 1.6 GB file with 11 million)
- Speed and performance
Cons
- Still in development

FancyGrid
A web grid library with server communication and charts integration. Also supports major frameworks of JavaScript.
Has lots of features, such as:
- Paging,
- Sorting and filtering,
- Ajax and Files data,
- RESTful,
- Flexible CRUD,
- Integration with charts and modern frameworks,
- Form module,
- Touch Support and others.
The smart modules system automatically detects as well as loads needed modules. Besides this large list, the library has great documentation and a lot of examples to examine the capabilities of FancyGrid to the fullest.
Pivot grids
Pivot tables are universal data analysis soldiers. No one works better than them with grouping and hierarchical data and does not help statistical calculations.
PivotTable.js
PivotJS depends on JQuery & JQuery UI and basically is a free open-source Javascript Pivot Table implementation with drag & drop functionality. The component is super simple but provides all the essential functionality that should be in pivot grids:
- sorting and filtering,
- slicing and dicing through data,
- aggregating,
- visualizing.
The last point is actually more interesting than you think because PivotJS has such a unique feature as ‘Table Bar Chart’ – this option puts an appropriately skewed bar in each of the table cells, representing the value.
The beginning of work with this component is super-straight forward and informative documentation will help you to customize the pivot grid in your own way.
Cons
- Limited customization
- Performance issues with large datasets
- No updates since 2016

WebDataRocks Pivot Grid
Now we’ll tell a bit more about our pivot table. WebDataRocks Pivot is a web-based pivot table component that provides powerful data analysis and visualization capabilities. It enables developers to integrate interactive pivot tables into web applications, allowing users to explore and analyze their business datasets with ease. With this component, you can have a very quick start embedding the pivot into your project.
- 100% free
- Cross-platform compatibility
- Advanced customization
- drilling down and filtering,
- customizing the look and feel of the grid,
- number and conditional formatting,
- user friendly UI,
- Exporting and sharing.
Cons
- 1MB data limit
You can localize the component and translate it to your language, change the layout of reports, or customize the Toolbar and context menu – everything you need for insightful reporting and even more.

Flexmonster Pivot Table & Charts
Flexmonster is a powerful web-based pivot table and charting component that provides advanced data analysis and reporting capabilities. It is an advanced commercial version of WebDataRocks. It has all the same functionality and a lot more. The pivot component also includes:
- built-in pivot charts,
- expanded customization options for all parts of the pivot
- Integration with the most popular frameworks
- extended localizations
- Chart integration
- High performance with big datasets
- Custom data source API for communication with your server.
The product is one of the most customizable pivot grids on the market: on the website, you can view the extensive list of possible customization options and examples.

DevExtreme
DevExtreme Pivot is a powerful component provided by DevExpress that offers comprehensive pivot table functionality for web applications. DevExtreme Pivot Grid provides extensive customization options that empower end-users to organize and present data in the most effective way.
- Integration with charts
- Rich customization functionality
- Connecting to OLAP
Cons
- Not updated regularly
- Licensing and cost

Calendars and kanbans
Сalendars and kanbans are mainly used to visualize and organize workflows, but they are also a very frequent request in the reporting software.
DHTMLX Kanban
DHTMLX Kanban is a feature-rich and versatile JavaScript library specifically designed for creating and managing Kanban boards.
Besides the ordinary kanban features the component will provide:
- Rich Javascript API to control each aspect of UI/UX
- Assigning tasks to a teammate
- Tracking time and deadlines
- Filtering and searching
- Checklists
- Comments
- Attachments to cards
- Easy integration with Angular, React, and Vue.js
Do you want to be the first to test the grid with your data?
Cons
- Limited customization

FullCalendar
This component is an open-source full-sized drag & drop JavaScript event calendar. Integrates with Vue, Angular, and React. The library is lightweight due to the usage of modular plugins and has more than 300 settings.
Also, FullCalendar suggests:
- 7 built-in views and the ability to create your own with their APIs,
- international localization and time zones,
- accessibility and touch support,
- and greatly extended documentation.
In addition to the above-mentioned web analytics reporting tools, there are such as ToastUI – JavaScript UI library and free open source project constantly managed by NHN. This is essentially a collection of components: there is already a calendar, table, charts, and even image editor.

Bryntum Calendar
Bryntum Calendar is a flexible JavaScript calendar component. With this tool, you can create interactive and customizable calendars with rich functionality. It is an effective solution for implementing interactive and customizable calendars in your applications.
- Wide customization option
- Interactive and responsive UI
- integration with various data sources, including JSON, REST APIs, or local storage.
Cons
- Price

Telerik Calendar
Telerik Calendar is a feature-rich and customizable JavaScript library that represents a graphical calendar. It adopts a standard calendar layout, allowing users to easily navigate and choose dates according to their needs.
- Integration with other Telerik components
- Feature-rich calendar functionality (support for displaying events, appointments, tasks, or any time-based information)
- client-side API
Cons
- Price

Final words
Вy combining these libraries, you can assemble your own project as a constructor or puzzle. Of course, each component has its own characteristics and limitations, but also provides many customization options and is flexible. And of course – no one bothers you to make your own add-ons and improve these technologies in the places you need. So go on and create more!
Also, we would love to know what you think about this list: maybe you have some other suggestions or cool products on your mind and stack? Share them with us!
What else to read?
- The Future of Data Visualization: Predictions and Trends for 2023 and Beyond
- What emerging technologies are shaping the future of software development in 2023?
- Learn more about JavaScript on Gitconnected.