HR dashboard with Highcharts and Web Pivot Table component
In this article
Discover how to track key HR metrics, visualize data effectively, and make data-driven decisions to improve employee performance and overall business outcomes.
Today we’re going to talk about analytics. To be more precise – HR analytics.
We’ll clarify why it is so important for small-, medium- and large-sized businesses and how you can implement a custom solution for HR data analysis simply using charts and a pivot table without investing a lot of developer resources?
You might be wondering: why does your company need to focus on it at all? – Fortunately, we have all the answers for you here.
First of all, it helps to evaluate the performance of the company’s departments and answer crucial questions regarding the work of employees.
Though often being underestimated, HR analytics also gives the power to transform how the HR department performs by testing the effectiveness of the implemented strategies.
In other words, provided that you use analytics to the fullest extent, you can improve employee performance, get a bird’s eye view of your business and make data-driven decisions relying on extracted insights rather than simple intuition.
Before the start, we suppose you’ve already managed to outline your business goals. The goals may vary from company to company but the foremost ones may include:
- recognizing trends in the current workforce.
- increasing employee retention rates, engagement, and performance.
- predicting voluntary and involuntary turnover.
Then, you need to identify metrics to track.
We took care of it and have prepared a kind of memo for you.
It’s fundamental metrics we’re going to analyze in this tutorial and corresponding types of visualization. (!But bear in mind that you can always calculate your own metrics with the help of tools we’ll mention below).
- Employee productivity (efficiency). This is the ratio of the employee output’s amount to time spent on a particular task or project.
- Turnover rate. Measures the number of employees leaving a company over time. With the multi-line chart, we can track a turnover rate in each department. This metric is often the center of the HR manager’s attention. The goal is to minimize this number.
- Revenue per employee. Measures the revenue per employee.
- Retention rate. This is the opposite of a turnover rate. Measures the percentage of employees remained at the end of a period. We can also measure it by the department.
- Employee engagement. Measures the level of the employee’s commitment. It is mostly affected by satisfaction and stress levels. We can use the line chart to track engagement for each person over months. Or within each department.
- Training costs per employee. Column chart.
- Overtime hours by departments and age groups. Best to analyze with a column chart.
- The number of part-time employees in the company.
- Hires to the goal. Total hires required to achieve the specified recruitment goal within a fixed time.
- Absenteeism (absence rate). Measures the percentage of total working time when employees are absent from work. You want it to be as low as possible.
- Ranges of salaries by departments.
And finally, demographics-related metrics:
- Employees’ countries of origin. We can display the top countries in a pie chart.
- Gender ratio. The ratio between the number of females and males in the company. Pie chart works here best since there are only two categories to depict.
- Age groups. Column chart.
Now, check all your data that you’ve already collected from various sources and start building your HR analytics solution.
We suggest the most popular way to communicate all the data through an interactive dashboard. You can easily implement this approach by combining WebDataRocks Pivot with Highcharts.
Both libraries work together like a charm and soon you’ll make sure of it. Let’s go-ahead to the dashboard’s creating!
Step 1: Add Highcharts dependencies
We’ll be adding all scripts into the <head> section of the web page to ensure they are run before the rest of the page is loaded.
To access Highcharts, include these scripts:
<script src="https://code.highcharts.com/highcharts.js"></script>
<script src="https://code.highcharts.com/highcharts-more.js"></script>
Let’s also add the export module to allow end-users to download charts as PDF, JPG, PNG, or SVG images:
<script src="http://code.highcharts.com/modules/exporting.js"></script>
If you want to enable exporting without an internet connection, you can add this script instead:
<script src="http://code.highcharts.com/modules/offline-exporting.js"></script>
Add containers where the charts will be rendered:
<div id="piechart-container"></div>
...
<div id="barchart-container"></div>
Create as many containers as there will be charts on the dashboard.
Step 2: Add WebDataRocks Pivot
It’s time to configure a reporting tool in your project.
Include WebDataRocks scripts and styles:
<link href="https://cdn.webdatarocks.com/latest/webdatarocks.min.css" rel="stylesheet">
<script src="https://cdn.webdatarocks.com/latest/webdatarocks.toolbar.min.js"></script>
<script src="https://cdn.webdatarocks.com/latest/webdatarocks.js"></script>
To apply the dark theme, add the corresponding styles:
<link rel="stylesheet" type="text/css" href="https://cdn.webdatarocks.com/latest/theme/dark/webdatarocks.min.css" />
Create the container for the pivot table:
<div id="pivot-container"></div>
Step 3: Initialize the pivot table on the page
var pivot = new WebDataRocks({
    container: "#pivot-container",
    toolbar: true,
    report: {
        dataSource: {
            data: getData()
        }
    }
});
To load data into the component, define and set a function that returns the JSON data:
function getData() {
    return [
        {
            "id": 1,
            "Full Name": "Sallyanne Tryhorn",
            "Job Title": "Software Consultant",
            "Country": "Sweden",
            "Gender": "F",
            "Employee Engagement": 0.8,
            "Part-time": "No",
            "Revenue per employee": 889,
            "Hours Spent for Project": 66,
            "University": "Kalmar University College",
            "Currency": "SEK",
            "Department": "Business Development",
            "LinkedIn Skill": "Brand Management",
            "Month Salary": 1229,
            "Overtime Hours": 12,
            "Employment start date": "9/26/2015",
            "Age Group": "<21"
        }
    ]
}
Don’t forget to specify data types for JSON!
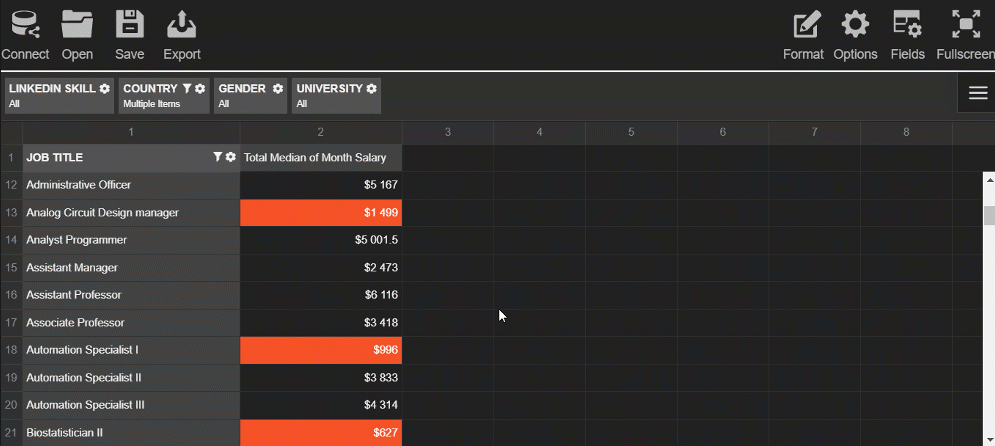
Step 4: Create a report
Now that your pivot contains the data, it's time to analyze it.
To provide your end-users with a meaningful report, set a slice that describes which hierarchies have to be placed to the rows, columns, and measures.
As well as a report, this object has a JSON structure:
"slice": {
    "rows": [{
        "uniqueName": "Department"
    }],
    "columns": [{
        "uniqueName": "Measures"
    }],
    "measures": [{
        "uniqueName": "Total Overtime Hours",
        "formula": "sum(\"Overtime Hours\") ",
        "caption": "Total Overtime Hours"
    }],
    "sorting": {
        "column": {
            "type": "desc",
            "tuple": [],
            "measure": "Total Overtime Hours"
        }
    }
}
This slice helps to get an understanding of the overtime hours by departments.
Try exploring the data interactively - drag and drop the hierarchies on the grid and save the resulting report.
Step 5: Pass the data to the charts
Before creating the charts and filling them with the data, we need to process the data to the appropriate formats.
Each chart requires a different data structure. To save your time, add the WebDataRocks connector for Highcharts to get access to the ready-to-use methods that handle data processing:
<script src="https://cdn.webdatarocks.com/latest/webdatarocks.highcharts.js"></script>
Next, we need to write code that performs the following scenario for each chart type:
- Gets the data from the pivot table component. On this step, you can specify which subset of the data you want to visualize.
- Processes this data with the help of the connector's methods.
- Creates the chart and sends the data to it.
- Each time the report on the grid is updated, the renewed data has to be resent to the chart.
To know whether the pivot table is ready to provide the data, we should use an event handler for reportcomplete.
Here's a simple example of the handler you can attach to the event:
reportcomplete: function() {
    pivot.off("reportcomplete");
    createPieChart();
    createBarChart();
}
To keep the blog post concise, I prefer not to include all the code here - you can find all the details of charts creating in the CodePen demo. You can also see there how to apply a dark theme for Highcharts.
Step 6: Enjoy the resulting dashboard
See how the dashboard looks like as a result:

This dashboard is completely ready to be an efficient instrument for HR analytics. Your end-users can interact both with a pivot table and charts, change reports on the fly and look at the data from multiple angles.
Coupled together, the pivot table and charts complement each other and make your data speak.
Hopefully, the presented approach will help you to get insights from the data, showcase your data story to the colleagues and improve the business performance in the long run.